Deterioration in the real interest rate of an economy can lead to an economic downturn. In essence, if inflation rates exceed the interest rates on lending, the profitability of commercial banks is eroded and lending to businesses and individuals dries up. As a result, the production and consumption of goods and services by these would-be borrowers falters.
- Most economies at some point experience negative real interest rates. During the 2014-2015 period, Argentina, Japan, Mexico, Ukraine, the United Kingdom, and Venezuela, among other economies, experienced negative real interest rates, meaning that the inflation rate exceeded the lending interest rate.
- Last July, US real interest rates on the 10-year Treasury bills fell below zero for the first time since 2012. For the economy more broadly, as is the case now, the United States experienced a period of relatively low real interest rates during the 1970s, with a single one-year period - 1975 - falling into negative territory (-1.28 percent).
To complicate matters, the reasons for and repercussions to an economy of low or negative real interest rate depends on a myriad of other factors, including an economy's size and demographic profile, capacity and maturity of its banking system and related financial institutions, demand for safe assets, and other factors. The duration of the low or negative interest rates also affects policy decisions to guard against other economic consequences.
- A low real interest rate can signal that a country is a low credit risk and has a relatively stable economy, helping to boost economic growth to prevent recession or aid economic recovery. Maintained at a low rate over several years, however, with no return to stronger economic growth will probably trigger other policy responses to address the consequences of low rates throughout an economy including on the health of the banking sector and wealth distribution between economic classes.
- Negative interest rates, while less optimal, pose a greater threat when nominal lending interest rates are also low, as observed at various points in history in Japan, the United Kingdom, and a handful of other advanced countries.
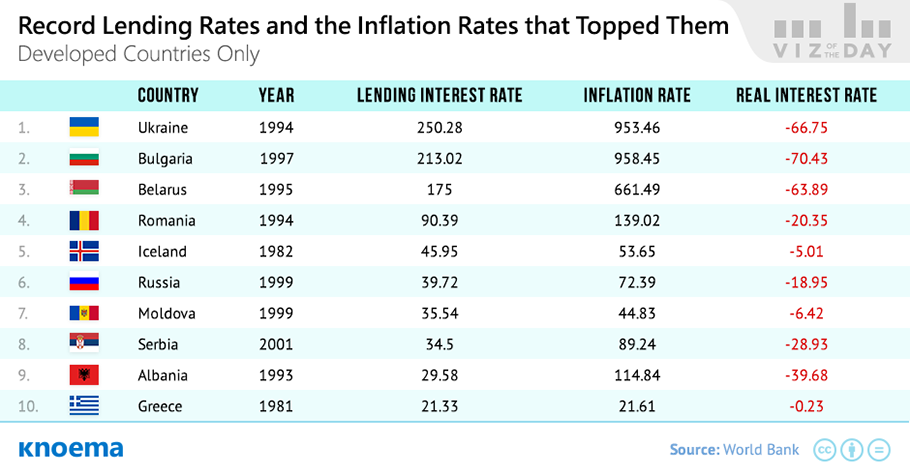
- Even more economically disruptive are scenarios in which the negative real interest rate is coupled with high interest rates on lending, such as in Argentina, Brazil, Ukraine, and Venezuela. This scenario is more common among developing economies in which banks dominate the financial system.
 Try now
World in 2020
Access and compare forecasts for more than 50 indicators related to a country’s economic, demographic, and energy futures from leading international institutions. Assess the historic quality of forecasts with our Forecast Accuracy Tracking Tool™ and select the most accurate forecast to support your analysis.
Материалы по теме
Мировой рейтинг стран по ВВП в 2015 году | Данные и Графики
GDP forecast for 2016 | Historical GDP (since 1970) | GDP (current US$) | GDP (current PPP int$) | GDP per capita | GDP per capita ranking | Real GDP growth | GDP by country GDP is the single most commonly referenced figure to cover the entirety of a national economy and the trajectory it is on in a single statistic. Measured annually, quarterly, or monthly, trends in GDP for a single country or comparisons among peer countries are often called out in popular press, sometimes with alarmist tones that can make one wonder why or how this single data point has taken on such importance. This is particularly the case in a world increasingly...
GDP by Country | Statistics from IMF, 1980-2021
The visualizations on this page provide an access to the GDP data by country from the IMF's World Economic Outlook (WEO). The table shows the data on the GDP measured in current prices as well as based on purchasing power parities (PPP). Charts at the right visualize country's GDP presented in the table to enable a visual analysis of GDP dynamics. Take a look at other GDP-related dashboards: GDP: GDP by country from the World Bank | GDP by country from IMF | World GDP ranking | World GDP GDP per capita: GDP per capita by country from the World Bank | GDP per capita by country from IMF | World GDP per capita ranking See also: G20...
World GDP per Capita Ranking 2016 | Data and Charts | Forecast
GDP per capita determines the level of economic development of the country: the higher the GDP per capita in a country the higher the economic wealth of its citizens. Since the beginning of the century, Luxembourg, Switzerland, and Norway have the sustainable high positions of GDPs per capita at current prices with Luxembourg being the leader. IN 2016, Luxembourg's GDP per capita has grown by 3,110 $ compared to 2015 to reach a level of approximately 100,000 US dollars. At that, the real GDP growth of Luxembourg is estimated at 3.5 percent in 2016 which is 1.3 percentage points less than in the previous year. GDP per capita based on...
GDP per Capita by Country | Statistics from IMF, 1980-2021
The page provides an access to the GDP per capita data for different countries from the IMF's World Economic Outlook (WEO). The table shows the data on the GDP per capita measured in current prices as well as based on purchasing power parities (PPP). The chart at the right displays a country's GDP per capita as a share of GDP per capita of the United States. Take a look at other GDP-related dashboards: GDP: GDP by country from the World Bank | GDP by country from IMF | World GDP ranking | World GDP GDP per capita: GDP per capita by country from the World Bank | GDP per capita by country from IMF | World GDP per capita ranking See...