Revision of World Economic Outlook from IMF, October 2016
АрхивOn Tuesday, October 4, International Monetary Fund released the new edition of its World Economic Outlook (WEO). According to the updated estimates, global economic growth in 2016 will slow to 3.08 percent from 3.2 percent in 2015. This is a downward revision relative to the previous April's estimate in which world's GDP growth was expected to rise this year.
Released twice a year, in April and October, WEO contains projections of key economic and financial indicators such as GDP, inflation, unemployment, the balance of payments, government finance, trade, and major commodity prices at the global level and in many countries.
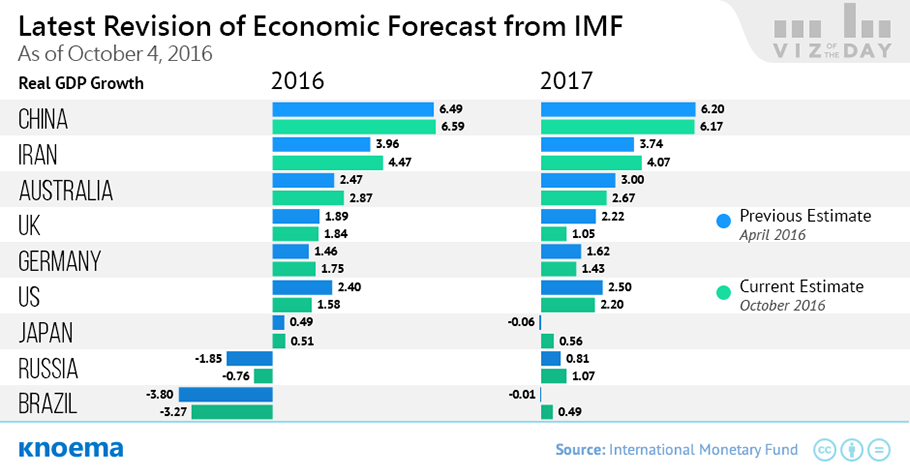
In the October edition of WEO, global economic growth was revised down mainly due to the subdued growth in advanced countries, especially in the United States. The growth of the U.S. GDP in 2016 will be 0.8 percentage points weaker than expected. On the contrary, the growth of some developing economies was revised up. Thus, the recession in Russia in 2016 will be less sharp than it was estimated previously. The same is for the Brazilian economy, which will decline a bit less dramatically than was projected in October, and start to recover so far in 2017.
Improvement of the forecast for the emerging economies is connected with better prospects of economic growth in China in the near-term and some strengthening of energy prices. So, IMF expectations of average crude oil prices for 2017 were revised up by 24% from $40.99 to $50.64 per barrel.Energy prices firming along with removal of
Energy prices firming along with the removal of sanctions on Iran resulted in the upward revision of the republic's current account balance. While in April, current account balance of Iran was estimated to be -0.79 percent of GDP this year, in October's edition of WEO it turned positive to 4.17 percent of GDP.
 Try now
World in 2020
Access and compare forecasts for more than 50 indicators related to a country’s economic, demographic, and energy futures from leading international institutions. Assess the historic quality of forecasts with our Forecast Accuracy Tracking Tool™ and select the most accurate forecast to support your analysis.
Материалы по теме
GDP by Country | Statistics from IMF, 1980-2021
The visualizations on this page provide an access to the GDP data by country from the IMF's World Economic Outlook (WEO). The table shows the data on the GDP measured in current prices as well as based on purchasing power parities (PPP). Charts at the right visualize country's GDP presented in the table to enable a visual analysis of GDP dynamics. Take a look at other GDP-related dashboards: GDP: GDP by country from the World Bank | GDP by country from IMF | World GDP ranking | World GDP GDP per capita: GDP per capita by country from the World Bank | GDP per capita by country from IMF | World GDP per capita ranking See also: G20...
Мировой рейтинг стран по ВВП в 2015 году | Данные и Графики
GDP forecast for 2016 | Historical GDP (since 1970) | GDP (current US$) | GDP (current PPP int$) | GDP per capita | GDP per capita ranking | Real GDP growth | GDP by country GDP is the single most commonly referenced figure to cover the entirety of a national economy and the trajectory it is on in a single statistic. Measured annually, quarterly, or monthly, trends in GDP for a single country or comparisons among peer countries are often called out in popular press, sometimes with alarmist tones that can make one wonder why or how this single data point has taken on such importance. This is particularly the case in a world increasingly...
GDP per Capita by Country | Statistics from IMF, 1980-2021
The page provides an access to the GDP per capita data for different countries from the IMF's World Economic Outlook (WEO). The table shows the data on the GDP per capita measured in current prices as well as based on purchasing power parities (PPP). The chart at the right displays a country's GDP per capita as a share of GDP per capita of the United States. Take a look at other GDP-related dashboards: GDP: GDP by country from the World Bank | GDP by country from IMF | World GDP ranking | World GDP GDP per capita: GDP per capita by country from the World Bank | GDP per capita by country from IMF | World GDP per capita ranking See...
GDP by Country | Statistics from the World Bank, 1960-2015
GDP is the single most commonly referenced figure to cover the entirety of a national economy and its trajectory in a single statistic. Measured on the basis of purchasing power parities (PPP), GDP can be used for comparisons among peer countries. Using purchasing power parity with GDP involves a decrease of bias in economy estimation as PPP takes into account the relative cost of local goods, services and inflation rates of the country. Looking at the GDP figures from historic perspective allows understanding on what phase is the economy of a country at the moment. The data on GDP from the World Bank covers the period for the last half of...