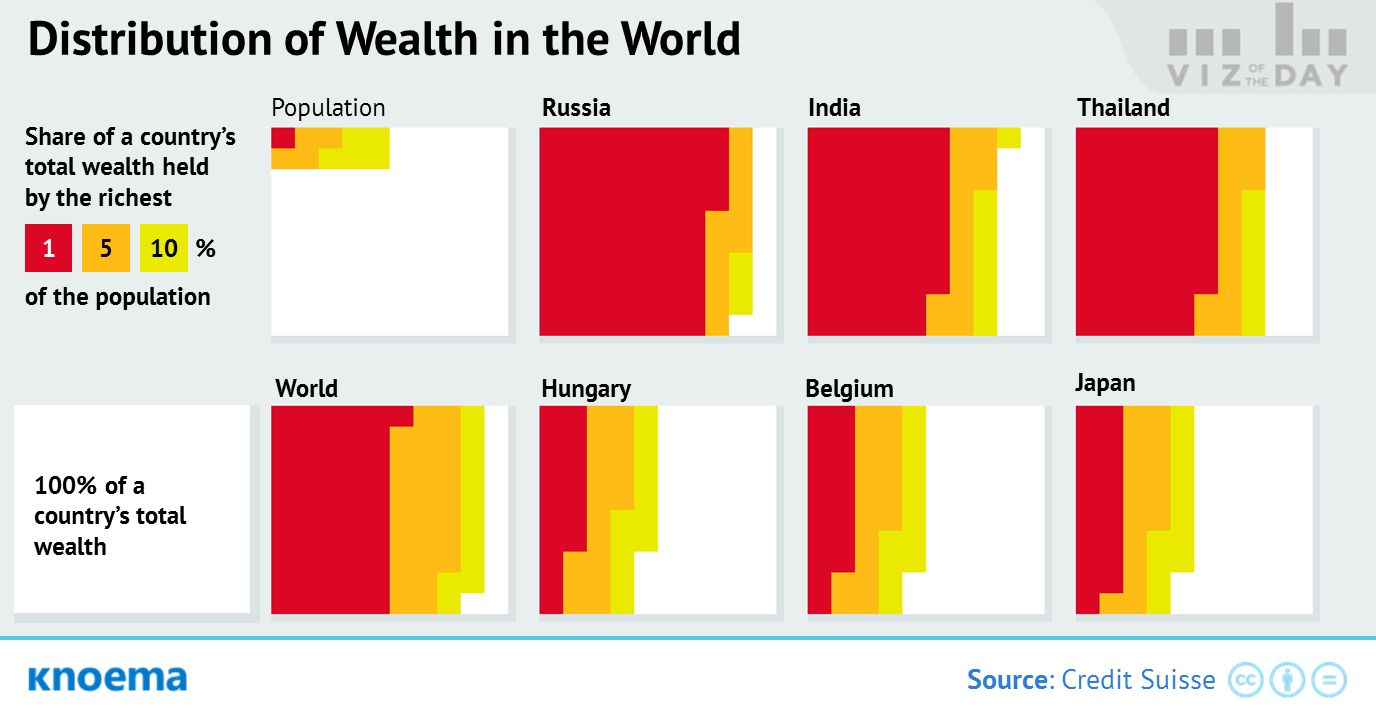
In 2016, just 1 percent of the world's population owned more than 50 percent of the world's wealth. According to the data from the Credit Suisse Research Institute, inequlity of world wealth continues to grow every year. The Institute's assessment is based on a global analysis of national wealth—defined as the value of the financial assets plus real estate (housing) owned by the households, less their debts—and use of the Gini Index, a traditional measure of income distribution and, thereby, inequality. As noted in the Institute’s report:
- About 3.5 billion people—or, 73 percent of the global population—own less than $10,000.
- Another 900 million people have between $10,000 and $100,000. This group represents the main driver of growth in demand for goods and services.
- That leaves the 65 million people globally who eacg possess more than $100,000, including 33 million multi-millionaires who control the bulk of global wealth.
An increase in wealth inequity can affect the economy of a given nation by reducing the purchasing power of the main drivers of economic growth. Which countries should be put on notice? Many.
- While the wealth distribution of countries differs widely, the number of US millionaires, the total population of African adults with wealth under $10,000, and the share of wealth represented by the top-1 percent of Russian citizens are especially noteworthy.
- Based on the Gini Index alone, many countries of central Europe score the best on income equality. Among the world's major economies, Japan scored the best on the Gini Index, however, the share of the country's population with wealth greater tha $100,000 is still seven times the global average.
Материалы по теме
US State Level Income Inequality
Rising income inequality in the United States over the past quarter century is well documented. For the vast majority of states, the share of income held by the top decile experienced a prolonged period of stability after World War II, followed by a substantial increase in inequality during the 1980s and 1990s. And the most interesting fact that the rising income inequality has positive correlation with the growth of real personal per capita income.Frank, Mark. W. 2009 "Inequality and Growth in the United States: Evidence from a New State-Level Panel of Income Inequality Measure" Economic Inquiry, Volume 47, Issue 1, Pages 55-68
Personal Income: US Counties
Personal incomes vary greatly among counties across the United States. While in New York County, New York, the average personal income per capita was about $122,000 in 2013, in Telfair, Georgia it was seven times lower at only $17,500. In the poorest 100 counties in the US, per capita income is less than $26,500 ($2,208 per month) on average. The level of economic well-being strongly correlates with Supplemental Nutrition Assistance Program (SNAP, the former Food Stamp Program) participation rates on a county-by-county basis. In counties with relatively high incomes, the number of SNAP recipients is generally less than 5 percent of the...
Poverty headcount ratio at urban poverty line
Source: Poverty and Inequality StatisticsEconomyCrimeDemographicsGDP, current prices USDHomicide RateTotal Population ForecastGDP, PPP current intern. $HomicidesPopulation Growth Rate ForecastGDP per capita, current prices USDPercentage of homicides by firearmPopulation Density ForecastGDP per capita, PPP current intern. $Number of homicides by firearmMedian Age of the Population ForecastForeign Direct InvestmentHomicide by firearm rate Total populationTotal External Debt, USDAssault, ratePopulation Growth RateShare of AgricultureKidnapping, ratePopulation DensityShare of ManufacturingRobbery, rateMedian Age of PopulationShare of...