Markets, despite their collective expertise, are apparently destined to repeat history as irrational exuberance is followed by an equally irrational despair. Periodic bouts of chaos are the inevitable result.
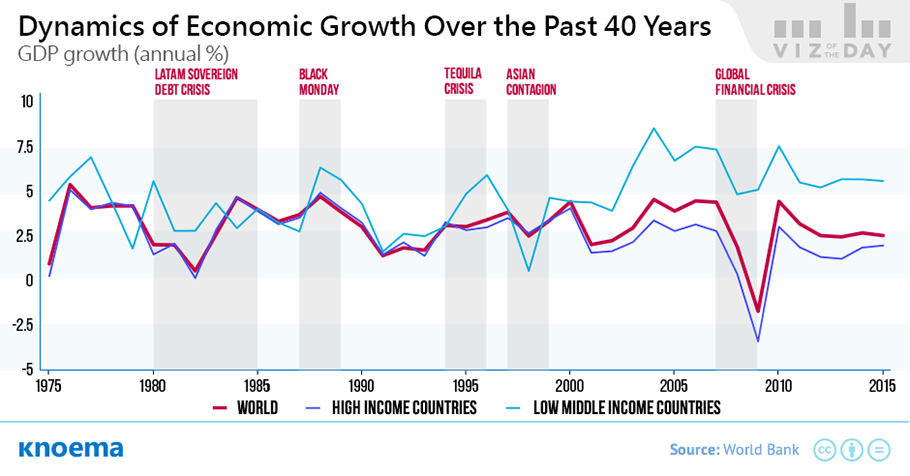
Financial crises have been an unfortunate part of the industry since its beginnings. Bankers and financiers readily admit that in a business so large, so global and so complex, it is naive to think such events can ever be avoided. A look at a number of financial crises over the last 40 years suggests a high degree of commonality: excessive exuberance, poor regulatory oversight, dodgy accounting, herd mentalities and, in many cases, a sense of infallibility.
 Try now
World in 2020
Access and compare forecasts for more than 50 indicators related to a country’s economic, demographic, and energy futures from leading international institutions. Assess the historic quality of forecasts with our Forecast Accuracy Tracking Tool™ and select the most accurate forecast to support your analysis.
Материалы по теме
The History of the Economic Forecasts
Each year several influential global agencies publish their views on the economic situation in the world. We have collected end-of-year baseline forecasts of the 5 largest agencies (IMF, World Bank, OECD, UN and the European Commission) for each available country since 1998 into the one dataset. In this page, you can observe forecasts for 2014-2017, which were made by each of those agencies in previous years, and analyze the accuracy of the forecasts from the historical perspective. It is hard to believe, but the data clearly shows that even the near-term forecasts were not considerably better than the simplest possible forecasting...
Мировой рейтинг стран по ВВП в 2015 году | Данные и Графики
GDP forecast for 2016 | Historical GDP (since 1970) | GDP (current US$) | GDP (current PPP int$) | GDP per capita | GDP per capita ranking | Real GDP growth | GDP by country GDP is the single most commonly referenced figure to cover the entirety of a national economy and the trajectory it is on in a single statistic. Measured annually, quarterly, or monthly, trends in GDP for a single country or comparisons among peer countries are often called out in popular press, sometimes with alarmist tones that can make one wonder why or how this single data point has taken on such importance. This is particularly the case in a world increasingly...
GDP by Country, 1980-2015
The visualizations below provide easy access to GDP by country. Additional prepared GDP-related visualizations are available at: historical (1970-2013) | GDP, current US$ | GDP, current PPP, int. $ | US GDP growth, forecast | real GDP growth | GDP by country | GDP per capita - ranked. If you did not find GDP statistics on your country, you may also visit these pages: GDP statistics and GDP per capita.
GDP per capita ranking 2016 | Data and Charts
Additional prepared GDP-related visualizations: historical (1970-2013) | GDP, current US$ | GDP, current PPP, int. $ | US GDP growth, forecast | real GDP growth | GDP by country Or, select an economic indicator: GDP forecast | inflation forecast | unemployment forecast |current account balance forecast | government debt forecast | short term economic profile NOTE: Purchasing power parity (PPP) between two countries, A and B, is the ratio of the number of units of country A’s currency needed to purchase in country A the same quantity of a specific good or service as one unit of country B’s currency will purchase in country B. PPPs can...