Each year several influential global agencies publish their views on the economic situation in the world. We have collected end-of-year baseline forecasts of the 5 largest agencies (IMF, World Bank, OECD, UN and the European Commission) for each available country since 1998 into the one dataset.
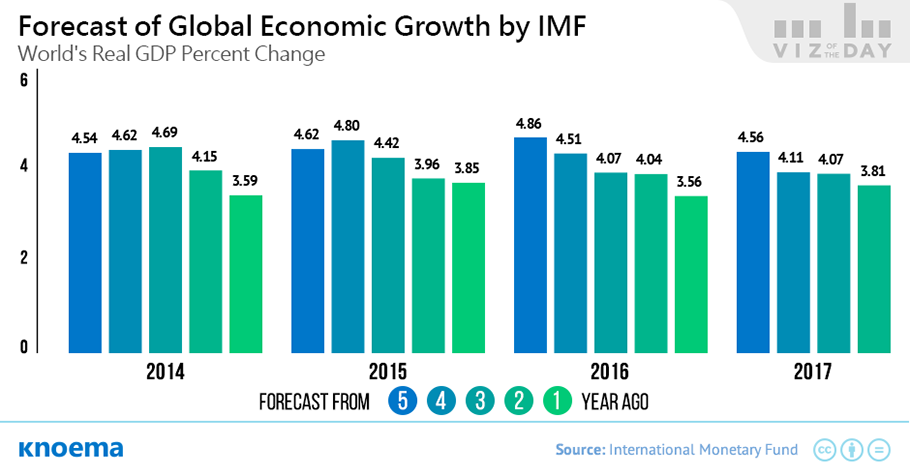
In this page, you can observe forecasts for 2014-2017, which were made by each of those agencies in previous years, and analyze the accuracy of the forecasts from the historical perspective.
It is hard to believe, but the data clearly shows that even the near-term forecasts were not considerably better than the simplest possible forecasting technique of using actual value for the current year to forecast the next year changes. Actually, in most cases this deadly simple and straightforward "rule of thumb" performed better than the forecasts of the global authorities (see the chart at the bottom of the page). However, it would be wrong to conclude that they are completely useless. It looks like when the agency's forecast differs from the previous year actual value significantly - it really means something. For example, in the end of 2009, all five organizations have correctly predicted the large economic rebound, which could not be forecasted only on the 2009-th numbers basis.
Dive deeper in the economic forecasts with our Forecast Tracking Tool.
 Try now
World in 2020
Access and compare forecasts for more than 50 indicators related to a country’s economic, demographic, and energy futures from leading international institutions. Assess the historic quality of forecasts with our Forecast Accuracy Tracking Tool™ and select the most accurate forecast to support your analysis.
Материалы по теме
Мировой рейтинг стран по ВВП в 2015 году | Данные и Графики
GDP forecast for 2016 | Historical GDP (since 1970) | GDP (current US$) | GDP (current PPP int$) | GDP per capita | GDP per capita ranking | Real GDP growth | GDP by country GDP is the single most commonly referenced figure to cover the entirety of a national economy and the trajectory it is on in a single statistic. Measured annually, quarterly, or monthly, trends in GDP for a single country or comparisons among peer countries are often called out in popular press, sometimes with alarmist tones that can make one wonder why or how this single data point has taken on such importance. This is particularly the case in a world increasingly...
GDP by Country | Statistics from the World Bank, 1960-2015
GDP is the single most commonly referenced figure to cover the entirety of a national economy and its trajectory in a single statistic. Measured on the basis of purchasing power parities (PPP), GDP can be used for comparisons among peer countries. Using purchasing power parity with GDP involves a decrease of bias in economy estimation as PPP takes into account the relative cost of local goods, services and inflation rates of the country. Looking at the GDP figures from historic perspective allows understanding on what phase is the economy of a country at the moment. The data on GDP from the World Bank covers the period for the last half of...
GDP by Country | Statistics from IMF, 1980-2021
The visualizations on this page provide an access to the GDP data by country from the IMF's World Economic Outlook (WEO). The table shows the data on the GDP measured in current prices as well as based on purchasing power parities (PPP). Charts at the right visualize country's GDP presented in the table to enable a visual analysis of GDP dynamics. Take a look at other GDP-related dashboards: GDP: GDP by country from the World Bank | GDP by country from IMF | World GDP ranking | World GDP GDP per capita: GDP per capita by country from the World Bank | GDP per capita by country from IMF | World GDP per capita ranking See also: G20...
World GDP per Capita Ranking 2017 | Data and Charts | Forecast
GDP per capita determines the level of economic development of the country: the higher the GDP per capita in a country the higher the economic wealth of its citizens. Since the beginning of the century, Luxembourg, Switzerland, and Norway have the sustainable high positions of GDPs per capita at current prices with Luxembourg being the leader. IN 2016, Luxembourg's GDP per capita has grown by 3,110 $ compared to 2015 to reach a level of approximately 100,000 US dollars. At that, the real GDP growth of Luxembourg is estimated at 3.5 percent in 2016 which is 1.3 percentage points less than in the previous year. GDP per capita based on...