The UEFA EURO 2016 kicked off last week with 24 national football teams competing during the next month for the title of continental champion of Europe. One question on the minds of fans, managers, and industry is how much team composition rules have influenced the performance of certain teams.
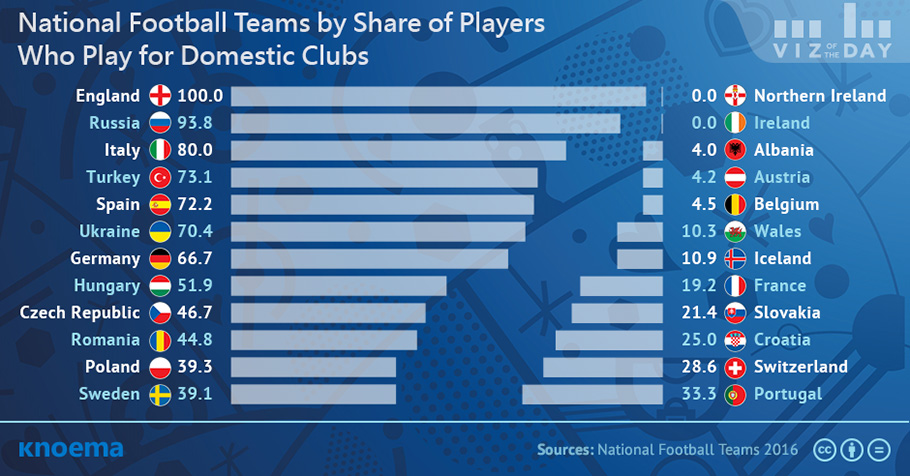
- Seventy-two percent of the players on the Spanish national team—winner of the two most recent championships, EURO 2012 and 2008—play for Spanish football clubs.
- In fact, 11 out of 16 finalist teams from the last eight UEFA Euro championships have a current roster composed of a majority of players who play exclusively for domestic clubs.
A player was historically permitted to represent any national team as long as he was a citizen of that country. In 2000, FIFA made national team eligibility rules more stringent to require a player demonstrate a "clear connection" to the team he wants to represent. A player meets the standard if he has been a resident for at least two years in the team country or has at least one parent or grandparent who was born in that country.
Outside international competitions, each sportsman may continue to play under contract for any football club of choice unless otherwise restricted by the national team. Since clubs do not have a clear connection requirement, athletes may play in parallel for a country's national team and for another country's club. National team thresholds governing how many of their players may represent other countries' clubs, however, has de facto acted as a clear connection requirement.
- All members of the English national team play for English clubs.
- In contrast, no member of Northern Ireland's national team plays for domestic clubs, members generally preferring English clubs. Similarly, only one member of Albania's national team plays for an Albanian club, while the rest of the team plays for clubs of 13 different countries.
Does team composition directly influence national team performance in international competitions like the EURO 2016? Ultimately, national team composition shifts continuously, changing not only national club representation among the team but the skills, experience, and internal dynamics of the teams, requiring a more detailed analysis of team performance to understand the influence of FIFA’s “clear connection” requirement.
Материалы по теме
Tour de France Statistics
The 104th Tour de France began July 1 in Düsseldorf, Germany and will end on the famous Champs-Elysees in Paris on July 23 after riders complete 21 stages and 3,540 km. Among the world’s most famous and prestigious cycling events, the Tour de France has been held each July since 1903.* A multi-stage race finishing in France but traversing neighboring countries, the Tour is organized around five stage types: flat, medium and high mountain, individual time, and intermediate sprint.The 2017 Tour includes 22 teams and 198 riders, continuing the trend of larger and larger starting fields in each Tour. In 1903, 60 cyclists competed and 21 finished...
Tour De France
July 23, 2012 "Tour de France" is undoubtedly the most prestigeuos race of the many bike races across the World. Some interesting facts about Tour de France:Its one of the few races that are more than 100 years old.The average speed of the winners have gone up from 21 Km/hr to more than 42 km/hr since the beginning of the race.The numner of participants have increased from 84 in 1912 to 198 in 2011.Almost 20% of the entrants dont make it to the finish.The longest race which was 5745 kms, was held in 1926.Last 10 years the race distance has been 3200-3600 kms. To get access to more detailed data, Click here...
Cricket World cup statistics(1975-2011)
The cricket is the wonderful game, where the competition between the teams goes higher in each and every game. Hence the performances over the years speaks more about it. Here are the world cup statistics from the year 1975-2011. This describes about the teams winning and losing data and the number of matches played in all the world cup tournament.