Sustained swings in commodity prices attract the attention of a variety of people around the world from traders, researchers, and analysts to policymakers and interested citizens. Commodity prices respond to changes in demand and supply forces as well as irrational exuberance of the markets. In today’s viz we opt to set aside price theory to focus instead on uncovering the largest price changes of 2016 for a selection of internationally traded commodities as well as the largest historic prices changes during the period monitored by the World Bank for the same commodities.
Largest commodity price increases
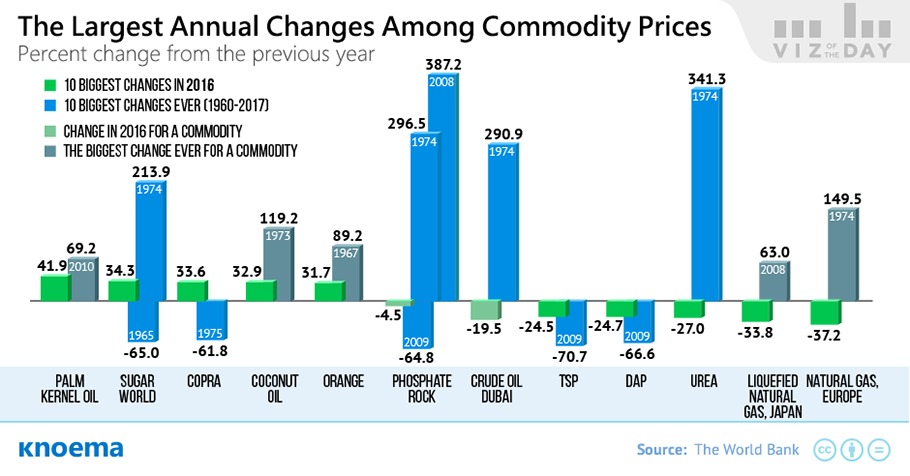
Palm kernel oil. The price of palm kernel oil showed the greatest growth among the examined commodities during 2016, increasing by almost 42 percent. When some markets banned trans fats because of negative attributed health consequences, manufacturers needed a cheap replacement with a similar texture and melting point, among other characteristics. Palm oil was the solution.
Sugar. Prices for sugar, сoconut products and some fruits have been consistently rising based on tight supply stemming from dry weather conditions and violent storms in several producing countries, including Thailand and regions of the Caribbean.
Coal. Between January 2016 when coal prices reached a 10-year low and November 2016, coal prices rebounded by 100 percent. Contributing to the increasing price of coal were threats from the All India Coal Workers’ Federation to strike. Despite claims by Coal India that it had ample inventory to prevent any market shortfalls, markets remained responsive to potential supply disruptions. China, traditionally a leading coal producer and consumer, has also begun increasing coal imports as it reduces domestic coal production to support its environmental objectives, further tightening the global supply-demand balance.
Largest commodity price decreases
Natural gas. Natural gas prices (Europe) showed the biggest decrease among all commodities during 2016, recording a 37 percent decrease. The price adjustment for liquefied natural gas (Japan) was close behind with a decline of 33.8 percent. Not only are LNG prices typically linked to crude oil prices, but natural gas and crude prices alike have been affect by a sluggish global economy, energy efficiency gains, and energy substitutes that have limited growth in energy consumption and constrained demand for traditional fossil fuesl. Depressed prices complicate final investment decisions for global LNG facilities with a history of ballooning costs—particularly in Australia—in the face of uncertain demand given competition from coal and renewable energy, among other factors.
Fertilizers. Prices for fertilizers continue to decline, although the market could already be nearing bottom. In 2016, urea prices declined by 27 percent, reaching the lowest value since 2004. Other common fertilizers, including TSP and DAP, showed similar declines. While conditions within the agriculture industries of some countries—stemming from weather disruptions and crop diseases to conflict and shifts in consumption, for example—forced some fertilizers producers out of the market, industry analysts report inventory remains high globally.
Материалы по теме
US Economic Outlook: Prices
Business Activity | Domestic Capital Accounts | Exchange Rates | Government Receipts, Expenditures and Investment | Housing Market | Industry | Interest Rates | Monetary Aggregates | National Accounts | Personal Income and Outlays | Disposable Personal Income per capita | Population and Labor Market: Employment | Labor Force Overview | Unemployment | Price Indexes & Deflators | Prices | Trade and International Transactions | Transportation | US Automotive Market Source: Fred, Prices
The Real Value of $100 in Each State, 2014
This dataviz shows the real value of $100 across states. Prices for the same goods are often significantly cheaper in such states as Missouri or Ohio than they are in states like New York or California. As a result, the same amount of cash can allow you to buy comparatively more in a low-price state than in a high-price one. Let's take Ohio, for example. It is a low-price state, where, $100 will buy you stuff that would have cost $111.98 in a state at the national average price level. In other words, it means that Ohioans are, for the purposes of day-to-day living, 11 percent richer than their incomes suggest. The states where $100 is...
US Economic Outlook: Price Indexes & Deflators
Business Activity | Domestic Capital Accounts | Exchange Rates | Government Receipts, Expenditures and Investment | Housing Market | Industry | Interest Rates | Monetary Aggregates | National Accounts | Personal Income and Outlays | Disposable Personal Income per capita | Population and Labor Market: Employment | Labor Force Overview | Unemployment | Price Indexes & Deflators | Prices | Trade and International Transactions | Transportation | US Automotive Market Bureua of Economic Analysis (BEA) prepares measures of real GDP and its components in a dollar-denominated form, designated “chained (2009) dollar estimates.” For GDP and...