The World's Largest Economy: China or the United States?
АрхивWhich is the world's largest economy, China or the United States? As is usual in the field of economics, “It depends.” It depends on the methods used to estimate the size of an economy and to compare one economy to another. Despite modern discussions on refining the calculation of gross domestic product (GDP), the standard measure of an economy’s size and performance, to be more inclusive of economic factors that have been ignored to date, such as environmental and natural resource depletion, there is no commonly accepted alternative to GDP. There are, however, at least two commonly used approaches to cross-country comparisons of GDP.
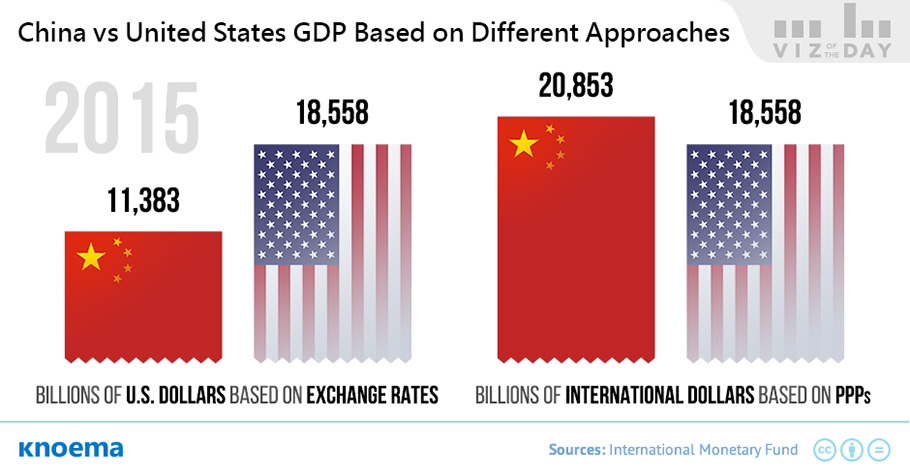
Method 1 - Current exchange rates. The GDP of two economies measured in each country’s national currency can be compared by converting the value of each GDP into a common third currency, such as US dollars, based on the current exchange rate. While the more popular approach, it is flawed. Official exchange rates differ from the real value of national currencies because currencies are not only exchanged to buy and sell goods and services in trade but are also used as investment instruments. As investment tools, currency valuations thus fall prey to speculation and irrational expectations of investors versus pure market fundamentals that are the basis for official rates.
Example. Based on the current ¥/$ exchange rate, if a bottle of Coca-Cola costs $1 in the United States it would cost ¥6.59 in China. Only, it wouldn't actually cost that much because the real value of the yuan relative to the dollar differes from the official exchange rate.
Method 2 - Purchasing power parity. Alternatively, the values of the national currencies of two economies can be converted to a single international currency — known as international dollars — using purchasing power parities (PPPs). PPPs are essentially the currency conversion rates that eliminate differences in price levels between countries and equalize the purchasing power of different countries. It is calculated as the ratio of the price of the same good in different countries in local currencies.
Example. If a bottle of Coca-Cola costs ¥2 in China and $1.25 in the United States then the PPP for Coca-Cola between these countries is ¥2/$1.25 = 1.6.
If you calculate the PPP for every good and service produced and average the values, you can calculate the PPP for the GDPs between two countries. Let’s return then to the question of whether the US or China has the larger economy. According to the IMF, in 2015, the PPP between China and the US was 3.53. As such, China’s GDP of ¥68.4 trillion would be worth $19.4 trillion in the United States (¥68.4/3.53). That’s $1.5 trillion, or nearly 8 percent, more than the US GDP of $17.9 trillion in 2015.
So, to answer the original question, China is the world's largest economy, followed by the United States ... if you compare GDPs based on PPP.
 Try now
World in 2020
What are the leading international institutions expecting in the years ahead for the world’s economies? How will demographic profiles shift by world region? Which countries are at the precipice of becoming world-scale natural resource producers? Explore global forecasts with Knoema!
Материалы по теме
Мировой рейтинг стран по ВВП в 2015 году | Данные и Графики
GDP forecast for 2016 | Historical GDP (since 1970) | GDP (current US$) | GDP (current PPP int$) | GDP per capita | GDP per capita ranking | Real GDP growth | GDP by country GDP is the single most commonly referenced figure to cover the entirety of a national economy and the trajectory it is on in a single statistic. Measured annually, quarterly, or monthly, trends in GDP for a single country or comparisons among peer countries are often called out in popular press, sometimes with alarmist tones that can make one wonder why or how this single data point has taken on such importance. This is particularly the case in a world increasingly...
GDP per Capita Ranking 2015 | Data and Charts
Additional prepared GDP-related visualizations: historical (1970-2013) | GDP, current US$ | GDP, current PPP, int. $ | US GDP growth, forecast | real GDP growth | GDP by country Or, select an economic indicator: GDP forecast | inflation forecast | unemployment forecast |current account balance forecast | government debt forecast | short term economic profile NOTE: Purchasing power parity (PPP) between two countries, A and B, is the ratio of the number of units of country A’s currency needed to purchase in country A the same quantity of a specific good or service as one unit of country B’s currency will purchase in country B. PPPs can...
GDP by Country, 1980-2015
The visualizations below provide easy access to GDP by country. Additional prepared GDP-related visualizations are available at: historical (1970-2013) | GDP, current US$ | GDP, current PPP, int. $ | US GDP growth, forecast | real GDP growth | GDP by country | GDP per capita - ranked. If you did not find GDP statistics on your country, you may also visit these pages: GDP statistics and GDP per capita.
GDP Statistics from the World Bank
Historical Data 1970-2014: GDP at current US$, GDP at current PPP int.$, Real GDP Growth, GDP Ranking, GDP by country, GDP per capitaG20 Economic Forecast: GDP growth, Inflation, Unemployment, Government Debt, Current Account Balance