У вас есть несохраненные страницы. Восстановить Отмена
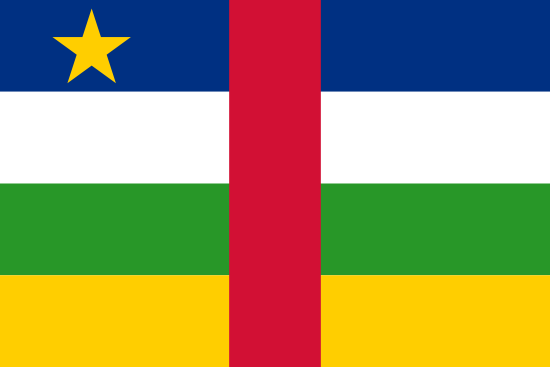
Центральноафриканская Республика
- Президент:Faustin-Archange Touadéra
- Премьер-министр:Simplice Sarandji
- Столица:Bangui
- Языки:French (official), Sangho (lingua franca and national language), tribal languages
- Правительство
- Статистическое агентство
- Население, человек:4 659 080 (2017)
- Площадь, кв км:622 980 (2017)
- ВВП на душу населения, долл. США:418 (2017)
- ВВП, млрд. долл. США:1,9 (2017)
- Индекс Джини:56,2 (2008)
- Рейтинг Ease of Doing Business:184 (2017)
- 3
 Октябрь 2016Источник: Philipps-University of Marburg, Empirical Institutional EconomicsЗагружен: KnoemaДата обращения к источнику: 07 декабря, 2016ВыбратьThe 3P Anti-trafficking Policy Index evaluates governmental anti-trafficking efforts in the three main policy dimensions (3Ps), based on the requirements prescribed by the United Nations Protocol to Prevent, Suppress and Punish Trafficking in Persons, especially Women and Children (2000). The three main policy dimensions (3Ps) are:Prosecution of perpetrators of human traffickingPrevention of human traffickingProtection of the victims of human trafficking Each of the 3P areas is evaluated on a 5-point scale and each index is aggregated to the overall 3P Anti-trafficking Index as the sum (score 3-15).Prosecution Index Score: 1 (no compliance) - 5 (full compliance)Prevention Index Score: 1 (no compliance) - 5 (full compliance)Protection Index Score: 1 (no compliance) - 5 (full compliance)3P Anti-trafficking Policy Index Score: 3 (no compliance for any of the three areas) - 15 (full compliance for all of the three areas) The 3P Anti-trafficking Policy Index is available for each country and each year and currently includes up to 189 countries for the preiod from 2000 to 2015.
- A
-
Декабрь 2018Источник: U.S. Energy Information AdministrationЗагружен: KnoemaДата обращения к источнику: 11 декабря, 2018ВыбратьWorld Electricity access database Hundreds of millions of people have gained access to modern energy over the last two decades, especially in China and India. Rapid economic development in several developing countries, increasing urbanisation and ongoing energy access programmes have been important factors in this achievement. The IEA Access to Energy database provides a snapshot of progress made toward meeting the ultimate goal of universal access. Note: For indicator population without access, value 1 represent <1 except Botswana, Guatemala countries
-
Июль 2016Источник: KnoemaЗагружен: KnoemaВыбратьAccuracy of annual economic forecasts of international organisations - European Commission, IMF, OECD, World Bank, UN LINK
-
Active contributors to an old age contributory scheme as a percent of the working age population by sex (%)Сентябрь 2014Источник: International Labour OrganizationЗагружен: KnoemaДата обращения к источнику: 31 августа, 2018ВыбратьThis indicator aims to capture the share of persons of working age protected through a contributory pension scheme (with benefits guaranteed but not currently being received). It provides information about the proportion of the working-age population that will receive an old age pension once reaching pensionable age. This right to income security in old age is guaranteed by the prior payment of premiums or contributions, i.e. before the occurrence of the insured contingency.
-
Active contributors to an old age contributory scheme as a percent of the working-age population (%)Май 2019Источник: International Labour OrganizationЗагружен: KnoemaДата обращения к источнику: 21 мая, 2019ВыбратьThis indicator aims to capture the share of persons of working age protected through a contributory pension scheme (with benefits guaranteed but not currently being received). It provides information about the proportion of the working-age population that will receive an old age pension once reaching pensionable age. This right to income security in old age is guaranteed by the prior payment of premiums or contributions, i.e. before the occurrence of the insured contingency.
-
Декабрь 2018Источник: Organisation for Economic Co-operation and DevelopmentЗагружен: KnoemaДата обращения к источнику: 03 декабря, 2018Выбрать
-
Март 2019Источник: World BankЗагружен: KnoemaДата обращения к источнику: 20 марта, 2019ВыбратьData cited at: The World Bank https://datacatalog.worldbank.org/ Topic: Africa Development Indicators Publication: https://datacatalog.worldbank.org/dataset/africa-development-indicators License: http://creativecommons.org/licenses/by/4.0/ Africa Development Indicators (ADI) provides the most detailed collection of development data on Africa, compiled from officially-recognized international sources. It presents the most current and accurate global development data available, and includes national, regional and global estimates.
-
Апрель 2019Источник: African Development Bank GroupЗагружен: KnoemaДата обращения к источнику: 17 апреля, 2019ВыбратьData cited at: https://infrastructureafrica.opendataforafrica.org/pbuerhd The Africa Infrastructure Development Index (AIDI) is produced by the African Development Bank. The AIDI serves a number of key objectives, principally: (i) to monitor and evaluate the status and progress of infrastructure development across the continent; (ii) to assist in resource allocation within the framework of ADF replenishments; and (iii) to contribute to policy dialogue within the Bank and between the Bank, RMCs and other development organizations.
-
Декабрь 2011Источник: African Development Bank GroupЗагружен: KnoemaВыбратьAfrica Millennium Development Goals
-
Декабрь 2013Источник: African Child Policy ForumЗагружен: KnoemaДата обращения к источнику: 26 февраля, 2014ВыбратьAfrica Report on Child Wellbeing - Access to services
-
Декабрь 2013Источник: African Child Policy ForumЗагружен: KnoemaДата обращения к источнику: 26 февраля, 2014ВыбратьAfrica Report on Child Wellbeing - Education
-
Декабрь 2013Источник: African Child Policy ForumЗагружен: KnoemaДата обращения к источнику: 26 февраля, 2014ВыбратьAfrica Report on Child Wellbeing - Exclusion Indicators
-
Декабрь 2013Источник: African Child Policy ForumЗагружен: KnoemaДата обращения к источнику: 27 февраля, 2014ВыбратьAfrica Report on Child Wellbeing - Governement expenditure
-
Декабрь 2013Источник: United Nations Children's FundЗагружен: KnoemaДата обращения к источнику: 26 февраля, 2014ВыбратьAfrica Report on Child Wellbeing - HIV AIDS
-
Декабрь 2013Источник: African Child Policy ForumЗагружен: KnoemaДата обращения к источнику: 26 февраля, 2014ВыбратьAfrica Report on Child Wellbeing - International and regional Child Related Legal Instruments
-
Декабрь 2013Источник: United Nations Children's FundЗагружен: KnoemaДата обращения к источнику: 26 февраля, 2014ВыбратьAfrica Report on Child Wellbeing - Maternal and child Health
-
Декабрь 2013Источник: African Child Policy ForumЗагружен: KnoemaДата обращения к источнику: 26 февраля, 2014ВыбратьAfrica Report on Child Wellbeing - Population
-
Октябрь 2012Источник: African Child Policy ForumЗагружен: KnoemaДата обращения к источнику: 01 марта, 2014ВыбратьAfrican Child Observatory Dataset, 2013
-
Август 2015Источник: African Development Bank GroupЗагружен: KnoemaДата обращения к источнику: 12 августа, 2015ВыбратьAfrican Development Bank, Bank Operations 2012
-
Декабрь 2011Источник: African Development Bank GroupЗагружен: KnoemaВыбратьAfrican Development Bank, Food Security, December 2011
-
Апрель 2019Источник: African Development Bank GroupЗагружен: KnoemaДата обращения к источнику: 11 мая, 2019ВыбратьData cited at: https://dataportal.opendataforafrica.org/mhuiccf
-
Январь 2019Источник: Mo Ibrahim FoundationЗагружен: KnoemaДата обращения к источнику: 21 января, 2019ВыбратьIbrahim Index of African Governance (IIAG) - is comprehensive statistical tool assessing African countries' performance in provision of public goods and services. Consisting of 133 variables derived from 32 independent sources IIAG measures governance performance across 4 pillars: Safety and Rule of Law, Participation and Human Rights, Sustainable Economic Opportunity and Human Development. All-embracing nature of the index makes it fairly the best instrument for setting long-term political, social and economical goals concerning the African region.
-
Апрель 2016Источник: African Development Bank GroupЗагружен: KnoemaДата обращения к источнику: 16 мая, 2016ВыбратьAfrican Regional Energy Statistics, 2014
-
Февраль 2013Источник: Central Statistical Agency of EthiopiaЗагружен: KnoemaДата обращения к источнику: 03 февраля, 2013Выбрать
-
Апрель 2019Источник: Organisation for Economic Co-operation and DevelopmentЗагружен: KnoemaДата обращения к источнику: 16 апреля, 2019Выбрать
-
Октябрь 2015Источник: World BankЗагружен: KnoemaДата обращения к источнику: 07 октября, 2015ВыбратьAfrica's Power Infrastructure: Investment, Integration, Efficiency by Anton Eberhard, Orvika Rosnes, Maria Shkaratan, Haakon Vennemo and Published by the World Bank.
-
Август 2013Источник: Economic and Statistical Observatory for sub-Saharan AfricaЗагружен: KnoemaДата обращения к источнику: 22 августа, 2013ВыбратьAfristat Socio-economic Database, 2013
-
Февраль 2019Источник: International Labour OrganizationЗагружен: KnoemaДата обращения к источнику: 15 февраля, 2019ВыбратьThe series is part of the ILO estimates and is harmonized to account for differences in national data and scope of coverage, collection and tabulation methodologies as well as for other country-specific factors. For more information, refer to the ILO estimates and projections methodological note.
-
Ноябрь 2018Источник: Food and Agriculture OrganizationЗагружен: KnoemaДата обращения к источнику: 22 марта, 2019ВыбратьThe data describe the average use of chemical and mineral fertilizers per area of cropland (arable land and permanent crops) at national, regional, and global level in a time series from 2002 to 2014The data describe the average use of chemical and mineral fertilizers per area of cropland (arable land and permanent crops) at national, regional, and global level in a time series from 2002 to 2015
-
Ноябрь 2018Источник: Food and Agriculture OrganizationЗагружен: KnoemaДата обращения к источнику: 27 мая, 2019ВыбратьThe Agri-environmental Indicators—Land domain provides information on the annual evolution of the distribution of agricultural and forest areas, and their sub-components, including irrigated areas, at national, regional and global levels.
-
Февраль 2018Источник: Food and Agriculture OrganizationЗагружен: KnoemaДата обращения к источнику: 27 мая, 2019ВыбратьThe Livestock Patterns domain of the FAOSTAT Agri-Environmental Indicators contains data on livestock numbers, shares of major livestock species and livestock densities in the agricultural area. Values are calculated using Livestock Units (LSU), which facilitate aggregating information for different livestock types. Data are available by country, with global coverage, for the period 1961–2014. This methodology applies the LSU coefficients reported in the "Guidelines for the preparation of livestock sector reviews" (FAO, 2011). From this publication, LSU coefficients are computed by livestock type and by country. The reference unit used for the calculation of livestock units (=1 LSU) is the grazing equivalent of one adult dairy cow producing 3000 kg of milk annually, fed without additional concentrated foodstuffs. FAOSTAT agri-environmental indicators on livestock patterns closely follow the structure of the indicators in EUROSTAT.
-
Декабрь 2018Источник: Food and Agriculture OrganizationЗагружен: KnoemaДата обращения к источнику: 27 мая, 2019ВыбратьThe data describe the average use of pesticides per area of cropland (arable land and permanent crops) at national level in a time series from 1990 to 2014.
-
Май 2013Источник: Food and Agriculture OrganizationЗагружен: KnoemaДата обращения к источнику: 22 марта, 2019Выбрать
-
Май 2013Источник: Food and Agriculture OrganizationЗагружен: KnoemaДата обращения к источнику: 22 марта, 2019Выбрать
-
Апрель 2019Источник: Organisation for Economic Co-operation and DevelopmentЗагружен: KnoemaДата обращения к источнику: 09 апреля, 2019Выбратьcommitment is a firm written obligation by a government or official agency, backed by the appropriation or availability of the necessary funds, to provide resources of a specified amount under specified financial terms and conditions and for specified purposes for the benefit of a recipient country or a multilateral agency. Members unable to comply with this definition should explain the definition that they use. -- Commitments are considered to be made at the date a loan or grant agreement is signed or the obligation is otherwise made known to the recipient (e.g. in the case of budgetary allocations to overseas territories, the final vote of the budget should be taken as the date of commitment). For certain special expenditures, e.g. emergency aid, the date of disbursement may be taken as the date of commitment. -- Bilateral commitments comprise new commitments and additions to earlier commitments, excluding any commitments cancelled during the same year. Cancellations and reductions in the year reported on of commitments made in earlier years are reported in the CRS, but not in the DAC questionnaire. -- In contrast to bilateral commitments, commitments of capital subscriptions, grants and loans to multilateral agencies should show the sum of amounts which are expected to be disbursed before the end of the next year and amounts disbursed in the year reported on but not previously reported as a commitment. For capital subscriptions in the form of notes payable at sight, enter the expected amount of deposits of such notes as the amount committed.
-
Июль 2018Источник: Organisation for Economic Co-operation and DevelopmentЗагружен: KnoemaДата обращения к источнику: 06 июля, 2018ВыбратьDestination of Official Development Assistance Disbursements. Geographical breakdown by donor, recipient and for some types of aid (e.g. grant, loan, technical co-operation) on a disbursement basis (i.e. actual expenditures). The data cover flows from bilateral and multilateral donors which focus on flows from DAC member countries and the EU Institutions.
-
Июнь 2013Источник: World BankЗагружен: KnoemaДата обращения к источнику: 21 ноября, 2014ВыбратьData cited at: The World Bank https://datacatalog.worldbank.org/ Topic: All The Ginis Dataset Publication: https://datacatalog.worldbank.org/dataset/all-ginis-dataset License: http://creativecommons.org/licenses/by/4.0/ This dataset includes combined and standardized Gini data from eight original sources: Luxembourg Income Study (LIS), Socio-Economic Database for Latin America (SEDLAC), Survey of Living Conditions (SILC) by Eurostat, World Income Distribution (WYD; the full data set is available here), World Bank Europe and Central Asia dataset, World Institute for Development Research (WIDER), World Bank Povcal, and Ginis from individual long-term inequality studies (just introduced in this version).
-
Alleged Offenders and Victims of Crimes Reported by the Police Forces to the Judicial Authority, ItalyМарт 2019Источник: National Institute of Statistics, ItalyЗагружен: KnoemaДата обращения к источнику: 01 апреля, 2019ВыбратьData source(s) used: Crimes reported to the Judicial authorities by the State Police, Carabinieri and Guardia di Finanza: Are processed the data on felonies and people who were reported by police to the court Other data characteristics: Data referring to social demographic characteristics of alleged offenders could not coincide with data on reports because of the different timing of extraction from police forces database.The sum of the crimes by province could not coincide with the total of the region, and that of the regions with the total Italy, because of the missed precise statement, for some crimes, of the place where they have been committed (or of the region of the committed crime but not of the province).
-
Annual growth rate of output per worker (measured as GDP in constant 2011 international $ in PPP) (%)Май 2019Источник: International Labour OrganizationЗагружен: KnoemaДата обращения к источнику: 20 мая, 2019ВыбратьThis indicator conveys the annual growth rates of labour productivity. Labour productivity represents the total volume of output (measured in terms of Gross Domestic Product, GDP) produced per unit of labour (measured in terms of the number of employed persons) during a given time reference period. The indicator allows data users to assess GDP-to-labour input levels and growth rates over time, thus providing general information about the efficiency and quality of human capital in the production process for a given economic and social context, including other complementary inputs and innovations used in production. For further information, see the SDG Indicators Metadata Repository or ILOSTAT's indicator description.
-
Июнь 2017Источник: International Tropical Timber OrganizationЗагружен: Pallavi SДата обращения к источнику: 24 июля, 2017ВыбратьITTO's Annual Review and Assessment of the World Timber Situation compiles the most up-to-date and reliable international statistics available on global production and trade of timber, with an emphasis on the tropics. It also provides information on trends in forest area, forest management and the economies of ITTO member countries.
-
Август 2018Источник: Food and Agriculture OrganizationЗагружен: KnoemaДата обращения к источнику: 19 ноября, 2018ВыбратьAQUASTAT is FAO's global information system on water and agriculture, developed by the Land and Water Division. The main mandate of the program is to collect, analyze and disseminate information on water resources, water uses, and agricultural water management with an emphasis on countries in Africa, Asia, Latin America and the Caribbean. This allows interested users to find comprehensive and regularly updated information at global, regional, and national levels.
-
Январь 2014Источник: World Resources InstituteЗагружен: KnoemaДата обращения к источнику: 07 декабря, 2015ВыбратьThis dataset shows countries and river basins' average exposure to five of Aqueduct's water risk indicators: baseline water stress, interannual variability, seasonal variability, flood occurrence, and drought severity. Risk exposure scores are available for every country (except Greenland and Antarctica), the 100 most populous river basins, and the 100 largest river basins by area. Scores are also available for all industrial, agricultural, and domestic users' average exposure to each indicator in each country and river basin. Citation: Gassert, F., P. Reig, T. Luo, and A. Maddocks. 2013. “Aqueduct country and river basin rankings: a weighted aggregation of spatially distinct hydrological indicators.” Working paper. Washington, DC: World Resources Institute, November 2013. Available online at http://wri.org/publication/aqueduct-country-river-basin-rankings.
-
Август 2015Источник: World Resources InstituteЗагружен: KnoemaДата обращения к источнику: 25 марта, 2019ВыбратьSuggested citation: Luo, T., R. Young, and P. Reig. 2015. "Aqueduct projected water stress rankings." Technical note. Washington, DC: World Resources Institute, August 215. Available online at http://www.wri.org/publication/aqueduct-projected-water-stress-country-rankings. Supplemental Materials: Country Scores WRI projected future country-level water stress for 2020, 2030, and 2040 under business-as-usual (BAU), optimistic, and pessimistic scenarios. Each tab lists country projected water stress scores for each scenario and year, weighted by overall water withdrawals. Scores weighted by individual sectors (agricultural, domestic, and industrial) are provided as well. These global projections are best suited to making comparisons among countries for the same year and among scenarios and decades for the same region. More detailed and localized data or scenarios can better estimate potential outcomes for specific regions and expose large sub-national variations that are subsumed under countrywide water-stress values. The country indicators face persistent limitations in attempting to simplify complex information, such as spatial and temporal variations, into a single number. They also do not account for the governance and investment structure of the water sector in different countries. It is important to note the inherent uncertainty in estimating any future conditions, particularly those associated with climate change, future population and economic trends, and water demand. Additionally, care should be taken when examining the change rates of a country’s projected stress levels between one year and another, because the risk-score thresholds are not linear. For more information on these limitations, see the technical note. Projections are described in further detail in: Luck, M., M. Landis, and F. Gassert, “Aqueduct Water Stress Projections: Decadal Projections of Water Supply and Demand Using CMIP5 GCMs,” Technical note (Washington, DC: World Resources Institute, April 2015), http://www.wri.org/publication/aqueduct-water-stress-projections. Water Stress withdrawals / available flow Water stress measures total annual water withdrawals (municipal, industrial, and agricultural) expressed as a percentage of the total annual available blue water. Higher values indicate more competition among users. Score Value [0-1) Low (<10%) [1-2) Low to medium (10-20%) [2-3) Medium to high (20-40%) [3-4) High (40-80%) [4-5] Extremely high (>80%)
-
Март 2019Источник: Stockholm International Peace Research InstituteЗагружен: KnoemaДата обращения к источнику: 19 марта, 2019ВыбратьData cited at: Stockholm International Peace Research Institute (SIPRI) The SIPRI Arms Transfers Database contains information on all transfers of major conventional weapons from 1950 to the most recent full calendar year. It is a unique resource for researchers, policy-makers and analysts, the media and civil society interested in monitoring and measuring the international flow of major conventional arms. For more information, see http://www.sipri.org/databases/armstransfers/sources-and-methods/
- B
-
Октябрь 2018Источник: Statistics DenmarkЗагружен: KnoemaДата обращения к источнику: 06 марта, 2019Выбрать
-
Ноябрь 2018Источник: U.S. Department of Commerce, Bureau of Economic AnalysisЗагружен: KnoemaДата обращения к источнику: 01 апреля, 2019ВыбратьU.S. Direct Investment Abroad: Balance of Payments and Direct Investment Position
-
Июнь 2015Источник: Barro-LeeЗагружен: KnoemaДата обращения к источнику: 12 октября, 2015ВыбратьData cited at: Barro-Lee
-
Апрель 2014Источник: United Nations Conference on Trade and DevelopmentЗагружен: KnoemaДата обращения к источнику: 08 февраля, 2016ВыбратьUNCTAD's Bilateral FDI Statistics provides up-to-date and systematic FDI data for 206 economies around the world, covering inflows (table 1), outflows (table 2), inward stock (table 3) and outward stock (table 4) by region and economy. Data are in principle collected from national sources. In order to cover the entire world, where data are not available from national sources, data from partner countries (mirror data) as well as from other international organizations have also been used.
-
Апрель 2018Источник: World BankЗагружен: KnoemaДата обращения к источнику: 14 ноября, 2018ВыбратьThis data set provides a snapshot of migration and remittances for all countries, regions and income groups of the world, compiled from available data from various sources
-
Май 2019Источник: United Nations COMTRADEЗагружен: KnoemaДата обращения к источнику: 21 мая, 2019ВыбратьBoth ethanol and biodiesel are classified under the HS-6 digit categories that also contain other products. Biodiesel is an industrial product (as it is produced through a chemical process called transesterification) and classified under HS code 382490 - products, preparations and residual products of the chemical or allied industries not elsewhere specified. Ethanol is classified as an agriculture product under HS code 2207, which covers un-denatured (HS 2207 10) and denatured alcohol (HS 2207 20).
-
Апрель 2017Источник: Bloom ConsultingЗагружен: KnoemaДата обращения к источнику: 24 мая, 2017ВыбратьBloom Consulting was founded in 2003 as a Nation Branding consultancy. Our Headquarters are located in Madrid, with offices in Lisbon and São Paulo. Bloom Consulting has been interviewed by The Economist, Forbes and CNN . According to Country Branding Central www.countrybrandingwiki.org, our CEO José Filipe Torres, a recurrent lecturer in Universities such as Harvard, is considered one of the top 3 international experts in the field of Nation Branding, Region and City Branding, providing advisory for the OECD. In addition, Bloom Consulting publishes the Bloom Consulting Country Brand Ranking © annually for both Trade and Tourism, to extensively analyze the brand performance of 193 countries and territories worldwide and the Digital Country Index - Measuring the Brand appeal of countries and territories in the Digital World.
-
Февраль 2019Источник: BPЗагружен: KnoemaДата обращения к источнику: 03 мая, 2019ВыбратьBP Energy Outlook Charts Data Pack - 2019 edition The Energy Outlook considers different aspects of the energy transition and the key issues and uncertainties these raise. In all the scenarios considered, world GDP more than doubles by 2040 driven by increasing prosperity in fast-growing developing economies. In the Evolving transition (ET) scenario this improvement in living standards causes energy demand to increase by around a third over the Outlook, driven by India, China and Other Asia which together account for two-thirds of the increase. Despite this increase in energy demand, around two-thirds of the world’s population in 2040 still live in countries where average energy consumption per head is relatively low, highlighting the need for ‘more energy’. Energy consumed within industry and buildings accounts for around three-quarters of the increase in energy demand. Growth in transport demand slows sharply relative to the past, as gains in vehicle efficiency accelerate. The share of passenger vehicle kilometres powered by electricity increases to around 25% by 2040, supported by the growing importance of fully-autonomous cars and shared-mobility services.
-
Апрель 2019Источник: Organisation for Economic Co-operation and DevelopmentЗагружен: KnoemaДата обращения к источнику: 15 апреля, 2019Выбрать
-
Март 2019Источник: World BankЗагружен: KnoemaДата обращения к источнику: 20 марта, 2019ВыбратьData cited at: The World Bank https://datacatalog.worldbank.org/ Topic: Jobs Publication: https://datacatalog.worldbank.org/dataset/jobs License: http://creativecommons.org/licenses/by/4.0/ The World Bank Jobs Statistics Over 150 indicators on labor-related topics, covering over 200 economies from 1990 to present.
- C
-
Октябрь 2017Источник: World Resources InstituteЗагружен: KnoemaДата обращения к источнику: 06 августа, 2018ВыбратьData Citation: CAIT Climate Data Explorer. 2017. Washington, DC: World Resources Institute. Available online at: http://cait.wri.org CAIT data carries a Creative Commons Attribution-NonCommercial 4.0 International license CAIT Historic allows for easy access, analysis and visualization of the latest available international greenhouse gas emissions data. It includes information for 186 countries, 50 U.S. states, 6 gases, multiple economic sectors, and 160 years - carbon dioxide emissions for 1850-2012 and multi-sector greenhouse gas emission for 1990-2012.
-
Январь 2017Источник: National Institute of Statistics, CameroonЗагружен: KnoemaДата обращения к источнику: 05 февраля, 2019ВыбратьData cited at: https://cameroon.opendataforafrica.org/xoddtbg Cameroon in the CEMAC zone, 2013
-
Май 2019Источник: Government of CanadaЗагружен: KnoemaДата обращения к источнику: 22 мая, 2019ВыбратьThis dataset is updated with data obtained from Statistics Canada and the U.S. Census Bureau. Current data June 2018. Trade Data is updated on a monthly and annual basis, with revisions in March, April, May, August and November to previous year's data. Trade Data is available on both product and industry-based versions. The product Trade Data is classified by Harmonized System (HS) codes while the industry data is based on North American Industry Classification System(NAICS) classification codes. Source: Statistics Canada and the U.S.Census Bureau
-
Май 2019Источник: Statistics CanadaЗагружен: KnoemaДата обращения к источнику: 10 мая, 2019ВыбратьFor the location "Puerto Rico" data is available from 1990.
-
Cancer Incidence, Mortality, Years of Life Lost, Years Lived with Disability, and Disability-Adjusted Life Years 1990-2016Декабрь 2018Источник: Institute for Health Metrics and EvaluationЗагружен: KnoemaДата обращения к источнику: 02 января, 2019ВыбратьData cited: Global Burden of Disease Collaborative Network. Global Burden of Disease Study 2016 (GBD 2016) Cancer Incidence, Mortality, Years of Life Lost, Years Lived with Disability, and Disability-Adjusted Life Years 1990-2016. Seattle, United States: Institute for Health Metrics and Evaluation (IHME), 2018. The Global Burden of Disease Study 2016 (GBD 2016), coordinated by the Institute for Health Metrics and Evaluation (IHME), estimated the burden of diseases, injuries, and risk factors for 195 countries and territories and at the subnational level for a subset of countries. Estimates for deaths, disability-adjusted life years (DALYs), years lived with disability (YLDs), years of life lost (YLLs), prevalence, and incidence for 29 cancer groups by age and sex for 1990-2016 are available from the GBD Results Tool. Files available in this record are the web tables published in JAMA Oncology in June 2018 in "Global, Regional, and National Cancer Incidence, Mortality, Years of Life Lost, Years Lived With Disability, and Disability-Adjusted Life-years for 29 Cancer Groups, 1990 to 2016."
-
Май 2019Источник: International Labour OrganizationЗагружен: KnoemaДата обращения к источнику: 21 мая, 2019ВыбратьA case of occupational injury is the case of a worker incurring an occupational injury as a result of an occupational accident. An occupational injury that is fatal is the result of an occupational accident where death occurred within one year from the day of the accident. Data are disaggregated by economic activity according to the latest version of the International Standard Industrial Classification of All Economic Activities (ISIC) available for that year. Economic activity refers to the main activity of the establishment in which a person worked during the reference period and does not depend on the specific duties or functions of the person's job, but on the characteristics of the economic unit in which this person works.
-
Май 2019Источник: International Labour OrganizationЗагружен: KnoemaДата обращения к источнику: 21 мая, 2019ВыбратьA case of occupational injury is the case of a worker incurring an occupational injury as a result of an occupational accident. An occupational injury that is fatal is the result of an occupational accident where death occurred within one year from the day of the accident.
-
Май 2019Источник: International Labour OrganizationЗагружен: KnoemaДата обращения к источнику: 21 мая, 2019ВыбратьA case of non-fatal occupational injury is the case of a worker incurring an occupational injury as a result of an occupational accident not leading to death. The non-fatal occupational injury entails a loss of working time. Data are disaggregated by economic activity according to the latest version of the International Standard Industrial Classification of All Economic Activities (ISIC) available for that year. Economic activity refers to the main activity of the establishment in which a person worked during the reference period and does not depend on the specific duties or functions of the person's job, but on the characteristics of the economic unit in which this person works.
-
Май 2019Источник: International Labour OrganizationЗагружен: KnoemaДата обращения к источнику: 21 мая, 2019ВыбратьA case of non-fatal occupational injury is the case of a worker incurring an occupational injury as a result of an occupational accident not leading to death. The non-fatal occupational injury entails a loss of working time.
-
Апрель 2019Источник: International Labour OrganizationЗагружен: KnoemaДата обращения к источнику: 24 мая, 2019ВыбратьA case of non-fatal occupational injury is the case of a worker incurring a non-fatal occupational injury as a result of an occupational accident, which entailed a loss of working time. Incapacity for work is the inability of the victim of an occupational accident, due to an occupational injury, to perform the normal duties of work in the job or post occupied at the time of the occupational accident. The incapacity for work can be permanent, when the persons injured were never able to perform again the normal duties of work in the job or post occupied at the time of the occupational accident causing the injury, or temporary, when the workers injured were unable to work from the day after the day of the accident, but were later able to perform again the normal duties of work in the job or post occupied at the time of the occupational accident causing the injury within a period of one year from the day of the accident.
-
Май 2019Источник: International Labour OrganizationЗагружен: KnoemaДата обращения к источнику: 24 мая, 2019ВыбратьA case of non-fatal occupational injury is the case of a worker incurring a non-fatal occupational injury as a result of an occupational accident, which entailed a loss of working time. Incapacity for work is the inability of the victim of an occupational accident, due to an occupational injury, to perform the normal duties of work in the job or post occupied at the time of the occupational accident. The incapacity for work can be permanent, when the persons injured were never able to perform again the normal duties of work in the job or post occupied at the time of the occupational accident causing the injury, or temporary, when the workers injured were unable to work from the day after the day of the accident, but were later able to perform again the normal duties of work in the job or post occupied at the time of the occupational accident causing the injury within a period of one year from the day of the accident. Data are disaggregated by economic activity according to the latest version of the International Standard Industrial Classification of All Economic Activities (ISIC) available for that year. Economic activity refers to the main activity of the establishment in which a person worked during the reference period and does not depend on the specific duties or functions of the person's job, but on the characteristics of the economic unit in which this person works.
-
Ноябрь 2018Источник: Institute for Health Metrics and EvaluationЗагружен: KnoemaДата обращения к источнику: 05 декабря, 2018ВыбратьThe Global Burden of Disease Study 2017 (GBD 2017), coordinated by the Institute for Health Metrics and Evaluation (IHME), estimated the burden of diseases, injuries, and risk factors for 195 countries and territories, and at the subnational level for a subset of countries.
-
Февраль 2019Источник: United Nations Children's FundЗагружен: KnoemaДата обращения к источнику: 08 апреля, 2019ВыбратьGlobal and regional deaths of children under 5 years of age by cause. Estimates generated by the WHO and Maternal and Child Epidemiology Estimation Group (MCEE) 2018.
-
Июнь 2018Источник: Statistics FinlandЗагружен: KnoemaДата обращения к источнику: 29 ноября, 2018ВыбратьData cited at: Statistics Finland http://www.stat.fi/index_en.html Publication: 030 -- Citizenship by sex, by region and municipality in 1990 to 2017 http://pxnet2.stat.fi/PXWeb/pxweb/en/StatFin/StatFin__vrm__vaerak/statfin_vaerak_pxt_030.px License: http://creativecommons.org/licenses/by/4.0/ Concepts and definitions Description Quality description These statistics apply the regional division of 1 January 2018 to the whole time series. Population statistics from 1750 to 2000 have been digitised into PDF format in the National Library's Doria service. Publications on Population structure and vital statistics in Doria (in Finnish) Publications on Population censuses in Doria (in Finnish) Area For reasons of privacy protection, cells with less than 10 cases of citizenship, country of birth, background country or language by municipality have been marked with two dots. Continent sums have not been hidden in municipality data nor have regional data concerning individual languages or countries. Citizenship If a person has two nationalities and one of them is Finnish, he/she will be included in statistics as a Finnish national. The used classification of continents is the classification of Eurostat, where Cyprus and Turkey belong to Europe. Citizens of non-autonomous states are summed under the mother country. Citizenship Czech Republic Czech Republic + Former Czechoslovakia Sudan Sudan + Former Sudan
-
Январь 2016Источник: World BankЗагружен: KnoemaДата обращения к источнику: 22 сентября, 2016Выбрать
-
Декабрь 2012Источник: World BankЗагружен: KnoemaДата обращения к источнику: 05 сентября, 2016Выбрать
-
Август 2013Источник: General Directorate of Statistics, Economic and Social Studies, Central African RepublicЗагружен: KnoemaДата обращения к источнику: 04 августа, 2013ВыбратьSource: RGPH 2003
-
Январь 2018Источник: Food and Agriculture OrganizationЗагружен: KnoemaДата обращения к источнику: 22 марта, 2019ВыбратьFood supply data is some of the most important data in FAOSTAT. In fact, this data is for the basis for estimation of global and national undernourishment assessment, when it is combined with parameters and other data sets. This data has been the foundation of food balance sheets ever since they were first constructed. The data is accessed by both business and governments for economic analysis and policy setting, as well as being used by the academic community.
-
Март 2016Источник: UNESCO Institute for StatisticsЗагружен: KnoemaДата обращения к источнику: 22 марта, 2016Выбрать
-
Май 2019Источник: Bank for International SettlementsЗагружен: KnoemaДата обращения к источнику: 13 мая, 2019ВыбратьThe consolidated banking statistics (CBS) measure international banking activity from a nationality perspective, focusing on the country where the banking group's parent is headquartered. While residence-based data such as the locational banking statistics indicate where positions are booked, they do not always identify where underlying decisions are made. This is because banking offices in one country may operate within a business model decided by the group's controlling parent, which may be headquartered in another country. The CBS capture the worldwide claims of banking groups based in reporting countries and exclude intragroup positions, similar to the consolidation approach followed by banking supervisors. The CBS provide several different measures of banking groups' country risk exposures, on either an immediate counterparty or an ultimate risk basis. The most appropriate exposure measure depends on the issue being analysed. The benchmark measure in the CBS is foreign claims, which capture credit to borrowers outside a banking group's home country. Measure for all Combinations - Amounts Outstanding / Stocks Note: Under "Reporting country" they have removed "Euro Area".
-
Май 2019Источник: Bank for International SettlementsЗагружен: KnoemaДата обращения к источнику: 06 мая, 2019ВыбратьBelow Parameters are common for all combinations : Frequency - Quarterly Measure -Amounts Outstanding / Stocks CBS Bank Type - Domestic Banks CBS Reporting Basis - Immediate Counterparty Basis Balance Sheet Position - Total Claims Type of Instruments - All Instruments Remaining Maturity - All Maturities Currency Type of Booking Location - All Currencies Counterparty Sector - All Sectors
-
Май 2019Источник: International Monetary FundЗагружен: KnoemaДата обращения к источнику: 23 мая, 2019ВыбратьConsumer price indexes (CPIs) are index numbers that measure changes in the prices of goods and services purchased or otherwise acquired by households, which households use directly, or indirectly, to satisfy their own needs and wants. In practice, most CPIs are calculated as weighted averages of the percentage price changes for a specified set, or ‘‘basket’’, of consumer products, the weights reflecting their relative importance in household consumption in some period. CPIs are widely used to index pensions and social security benefits. CPIs are also used to index other payments, such as interest payments or rents, or the prices of bonds. CPIs are also commonly used as a proxy for the general rate of inflation, even though they measure only consumer inflation. They are used by some governments or central banks to set inflation targets for purposes of monetary policy. The price data collected for CPI purposes can also be used to compile other indices, such as the price indices used to deflate household consumption expenditures in national accounts, or the purchasing power parities used to compare real levels of consumption in different countries.
-
Февраль 2019Источник: Food and Agriculture OrganizationЗагружен: KnoemaДата обращения к источнику: 05 марта, 2019ВыбратьThe FAOSTAT monthly CPI & Food CPI database was based on the ILO CPI data until December 2014. In 2014, IMF-ILO-FAO agreed to transfer global CPI data compilation from ILO to IMF. Upon agreement, CPIs for all items and its sub components originates from the International Monetary Fund (IMF), and the UN Statistics Division(UNSD) for countries not covered by the IMF. However, due to a limited time coverage from IMF and UNSD for a number of countries, the Organisation for Economic Co-operation and Development (OECD), the Latin America and the Caribbean statistics (CEPALSTAT), Central Bank of Western African States (BCEAO), Eastern Caribbean Central Bank (ECCB) and national statistical office website data are used for missing historical data from IMF and UNSD food CPI. The FAO CPI dataset for all items(or general CPI) and the Food CPI, consists of a complete and consistent set of time series from January 2000 onwards. These indices measure the price change between the current and reference periods of the average basket of goods and services purchased by households. The CPI,all items is typically used to measure and monitor inflation, set monetary policy targets, index social benefits such as pensions and unemployment benefits, and to escalate thresholds and credits in the income tax systems and wages in public and private wage contracts.
-
Февраль 2019Источник: International Labour OrganizationЗагружен: KnoemaДата обращения к источнику: 15 февраля, 2019ВыбратьThe series is part of the ILO estimates and is harmonized to account for differences in national data and scope of coverage, collection and tabulation methodologies as well as for other country-specific factors. For more information, refer to the ILO estimates and projections methodological note.
-
Декабрь 2018Источник: International Monetary FundЗагружен: KnoemaДата обращения к источнику: 22 февраля, 2019ВыбратьThe CDIS database presents detailed data on "inward" direct investment positions (i.e., direct investment into the reporting economy) cross-classified by economy of immediate investor, and data on "outward" direct investment positions (i.e., direct investment abroad by the reporting economy) cross-classified by economy of immediate investment. The CDIS database contains breakdowns of direct investment position data, including, in most instances, separate data on net equity and net debt positions, as well as tables that present "mirror" data (i.e., tables in which data from the reporting economy are shown side-by-side with the data obtained from all other counterpart reporting economies).
-
Январь 2019Источник: Transparency InternationalЗагружен: Pallavi SДата обращения к источнику: 01 февраля, 2019ВыбратьData cited at CORRUPTION PERCEPTIONS INDEX 2018 by Transparency International is licensed under CC-BY-ND 4.0. Global Corruption Barometer is the largest world-wide public opinion survey on corruption. see more at https://www.transparency.org/cpi2018 Transparency International(TI) defines corruption as the abuse of entrusted power for private gain. This definition encompasses corrupt practices in both the public and private sectors. The Corruption Perceptions Index (CPI) ranks countries according to the perception of corruption in the public sector. The CPI is an aggregate indicator that combines different sources of information about corruption, making it possible to compare countries. The CPI ranks almost 200 countries by their perceived levels of corruption, as determined by expert assessments and opinion surveys.
-
Сентябрь 2017Источник: KnoemaЗагружен: KnoemaДата обращения к источнику: 03 октября, 2017ВыбратьCollect the cost of Consulting Services, diagnostics services and clinical procedures. If you are residing in Major cities/towns where you have both Public and Private Healthcare services, you can join this project and earn money.
-
Апрель 2015Источник: International Monetary FundЗагружен: KnoemaДата обращения к источнику: 20 августа, 2015ВыбратьGlobal growth is forecast at 3.5 percent in 2015 and 3.8 percent in 2016, with uneven prospects across the main countries and regions of the world. The distribution of risks to near-term global growth has become more balanced relative to the October World Economic Outlook but is still tilted to the downside. The decline in oil prices could boost activity more than expected. Geopolitical tensions continue to pose threats, and risks of disruptive shifts in asset prices remain relevant. In some advanced economies, protracted low inflation or deflation also pose risks to activity. The chapter takes a region-by-region look at the recent development in the world economy and the outlook for 2015, with particular attention to notable development in countries within each region.
-
Март 2018Источник: Statistics FinlandЗагружен: KnoemaДата обращения к источнику: 29 ноября, 2018ВыбратьData cited at: Statistics Finland http://www.stat.fi/index_en.html Publication: 012 -- Country of birth according to age and sex by region in 1990 to 2017 http://pxnet2.stat.fi/PXWeb/pxweb/en/StatFin/StatFin__vrm__vaerak/statfin_vaerak_pxt_012.px License: http://creativecommons.org/licenses/by/4.0/ Concepts and definitions Description Quality description These statistics apply the regional division of 1 January 2018 to the whole time series. Population statistics from 1750 to 2000 have been digitised into PDF format in the National Library's Doria service. Publications on Population structure in Doria (in Finnish) Publications on Vital statistics in Doria (in Finnish) Publications on Population censuses in Doria (in Finnish) Country of birth The used classification of continents is the classification of Eurostat, where Cyprus and Turkey belong to Europe. Non-autonomous states are summed under their mother country. Country of birth Sudan Sudan + Former Sudan
-
Июнь 2018Источник: World BankЗагружен: KnoemaДата обращения к источнику: 19 июля, 2018ВыбратьThe World Bank's Country Policy and Institutional Assessment is done annually for all its borrowing countries. It has evolved into a set of criteria, which are grouped in four clusters: (a) economic management; (b) structural policies; (c) policies for social inclusion and equity; and (d) public sector management and institutions. The number of criteria, currently sixteen, reflect a balance between ensuring that all key factors that foster pro-poor growth and poverty alleviation are captured, without overly burdening the evaluation process. Ratings for each of the criteria reflect a variety of indicators, observations, and judgments. They focus on the quality of each country's current policies and institutions - which are the main determinant of present aid effectiveness prospects. To fully underscore the importance of the CPIA in the IDA Performance Based Allocations, the overall country score is referred to as the IDA Resource Allocation Index (IRAI)
-
Июнь 2017Источник: African Development Bank GroupЗагружен: KnoemaДата обращения к источнику: 24 августа, 2018Выбрать
-
Апрель 2018Источник: Organisation for Economic Co-operation and DevelopmentЗагружен: KnoemaДата обращения к источнику: 21 мая, 2018ВыбратьNote: CPA data for 2018 and 2019 are projections from the 2016 Survey on Forward Spending Plans. Country Programmable Aid (CPA), outlined in our Development Brief and also known as “core” aid, is the portion of aid donors programme for individual countries, and over which partner countries could have a significant say. CPA is much closer than ODA to capturing the flows of aid that goes to the partner country, and has been proven in several studies to be a good proxy of aid recorded at country level. CPA was developed in 2007 in close collaboration with DAC members. It is derived on the basis of DAC statistics and was retroactively calculated from 2000 onwards
-
Июль 2016Источник: Organisation for Economic Co-operation and DevelopmentЗагружен: KnoemaДата обращения к источнику: 29 июля, 2016ВыбратьCountry Programmable Aid (CPA), outlined in our Development Brief and also known as “core” aid, is the portion of aid donors programme for individual countries, and over which partner countries could have a significant say. CPA is much closer than ODA to capturing the flows of aid that goes to the partner country, and has been proven in several studies to be a good proxy of aid recorded at country level. CPA was developed in 2007 in close collaboration with DAC members. It is derived on the basis of DAC statistics and was retroactively calculated from 2000 onwards
-
Декабрь 2015Источник: International Monetary FundЗагружен: KnoemaДата обращения к источнику: 18 апреля, 2016ВыбратьCOFR presents data on fiscal transparency. It provides an overview of fiscal reporting, including whether fiscal data are available for all of the general government, whether the government reports a balance sheet, and whether spending and revenue are reported on a cash or accrual basis. It also derives specific indices of the coverage of public institutions, fiscal flows, and fiscal stocks.
-
Декабрь 2017Источник: Food and Agriculture OrganizationЗагружен: KnoemaДата обращения к источнику: 27 мая, 2019ВыбратьGHG emissions data from the cultivation of organic soils are those associated with nitrous oxide gas from organic soils under cropland (item: Cropland organic soils) and grassland (item: Grassland organic soils). The FAOSTAT emissions database is computed following Tier 1 IPCC 2006 Guidelines for National GHG Inventories (http://www.ipcc-nggip.iges.or.jp/public/2006gl/vol4.html). GHG emissions are provided by country, region and special groups, with global coverage, relative to the period 1990-present (with annual updates) and with projections for 2030 and 2050, expressed both as Gg N2O and Gg CO2eq, by cropland, grassland and by their aggregation. Implied emission factor for N2O as well activity data (areas) are also provided.
-
Май 2018Источник: United Nations Conference on Trade and DevelopmentЗагружен: KnoemaДата обращения к источнику: 28 июня, 2018ВыбратьThis table shows exchange rates for currencies used in over 190 world economies presented in a cross rates layout where countries are presented in both rows and columns. National currency per US dollars exchange rates are used to derive explicit exchange rates for each of the countries presented with regard to any other country. Country series are consistent over time: for example, a conversion was made from national currency to Euro for the Euro Zone economies for all years prior to the adoption of Euro.
- D
-
Июнь 2017Источник: Bank of CanadaЗагружен: KnoemaДата обращения к источнику: 05 декабря, 2018ВыбратьThe Bank of Canada’s Credit Rating Assessment Group (CRAG) comprehensive database of sovereign defaults draws on previously published data sets compiled by various official and private sector sources. It combines elements of these, together with new information, to develop estimates of stocks of government obligations in default, including bonds and other marketable securities, bank loans, and official loans in default, valued in U.S. dollars, for the years 1960 to 2016 on both a country-by-country and a global basis. This update of CRAG’s database, and subsequent updates, will be useful to researchers analyzing the economic and financial effects of individual sovereign defaults and, importantly, the impact on global financial stability of episodes involving multiple sovereign defaults.
-
Days lost due to cases of occupational injury with temporary incapacity for work by economic activityМай 2019Источник: International Labour OrganizationЗагружен: KnoemaДата обращения к источнику: 21 мая, 2019ВыбратьDays lost due to temporary incapacity refers to the total number of calendar days during which those persons temporarily incapacitated were unable to work, excluding the day of the accident, up to a maximum of one year. Temporary absences from work of less than one day for medical treatment are not included. Data are disaggregated by economic activity according to the latest version of the International Standard Industrial Classification of All Economic Activities (ISIC) available for that year. Economic activity refers to the main activity of the establishment in which a person worked during the reference period and does not depend on the specific duties or functions of the person's job, but on the characteristics of the economic unit in which this person works.
-
Days lost due to cases of occupational injury with temporary incapacity for work by sex and migrant statusАпрель 2019Источник: International Labour OrganizationЗагружен: KnoemaДата обращения к источнику: 21 мая, 2019ВыбратьDays lost due to temporary incapacity refers to the total number of calendar days during which those persons temporarily incapacitated were unable to work, excluding the day of the accident, up to a maximum of one year. Temporary absences from work of less than one day for medical treatment are not included.
-
Май 2019Источник: International Labour OrganizationЗагружен: KnoemaДата обращения к источнику: 24 мая, 2019ВыбратьTime lost per occupational injury is defined as the average number of calendar days lost per new cases of non-fatal occupational injury resulting in temporary incapacity.
-
Май 2019Источник: International Labour OrganizationЗагружен: KnoemaДата обращения к источнику: 24 мая, 2019ВыбратьDays not worked as a result of strikes and lockouts represent the total number of working days not worked as a result of strikes and lockouts in progress during the year. It is measured in terms of the sum of the actual working days during which work would normally have been carried out by each worker involved had there been no stoppage. Data are disaggregated by economic activity according to the latest version of the International Standard Industrial Classification of All Economic Activities (ISIC) available for that year. Economic activity refers to the main activity of the establishment in which a person worked during the reference period and does not depend on the specific duties or functions of the person's job, but on the characteristics of the economic unit in which this person works.
-
Январь 2017Источник: National Institute of Statistics, CameroonЗагружен: KnoemaДата обращения к источнику: 05 февраля, 2019ВыбратьData cited at: https://cameroon.opendataforafrica.org/vszafdc Demographic Statistics of African countries
-
Апрель 2018Источник: Institute for Health Metrics and EvaluationЗагружен: KnoemaДата обращения к источнику: 03 мая, 2018ВыбратьFinancing Global Health 2016 is the eighth edition of IHME’s annual series on global health spending and health financing. In addition to describing the trends in development assistance for health (DAH), this year’s report features an expanded discussion of domestic spending across low-, middle-, and high-income countries to describe the context in which DAH operates, identify health financing gaps, and support the pursuit of universal health coverage. Also new in Financing Global Health this year are detailed data for the funding of specific program areas within DAH for malaria and more thorough analysis of DAH for health system strengthening. This adds to the existing detailed tracking of DAH by program area for HIV/AIDS, maternal, newborn, and child health, and non-communicable diseases (NCDs). The coverage of domestic health spending builds on data and analyses presented in two papers published this year: “Global Burden of Disease Financing Global Health Collaborator Network. Evolution and patterns of global health financing 1995–2014: development assistance for health, and government, prepaid private, and out-of-pocket health spending in 184 countries,” and “Global Burden of Disease Financing Global Health Collaborator Network. Future and potential spending on health 2015–2040 by government, prepaid private, out-of-pocket, and donor financing for 184 countries.” Both analyses were published in The Lancet in April 2017. More information about these data and methods are found in the online methods annex.
-
Декабрь 2007Источник: International Telecommunication UnionЗагружен: KnoemaДата обращения к источнику: 23 мая, 2019ВыбратьThe Digital Opportunity Index (DOI) is the only index that includes price data for 181 economies, which is vital in assessing effective market demand. The Digital Opportunity Index (DOI) has been designed to as a tool for tracking progress in bridging the digital divide and the implementa- tion of the outcomes of the World Summit on the Information Society (WSIS). As such, it provides a powerful policy tool for exploring the global and regional trends in infrastructure, opportu- nity and usage that are shaping the Information Society.
-
Direct Investment Position Abroad on a Historical-Cost Basis: Country Detail by Industry, United StatesИюль 2018Источник: U.S. Department of Commerce, Bureau of Economic AnalysisЗагружен: KnoemaДата обращения к источнику: 10 августа, 2018ВыбратьDirect Investment Position Abroad on a Historical-Cost Basis: Country Detail by Industry, United States
-
Ноябрь 2018Источник: Institute for Health Metrics and EvaluationЗагружен: KnoemaДата обращения к источнику: 03 декабря, 2018ВыбратьGBD 2017 - Disability-Adjusted Life Years and Healthy Life Expectancy 1990-2017 The Global Burden of Disease Study 2016 (GBD 2016), coordinated by the Institute for Health Metrics and Evaluation (IHME), estimated the burden of diseases, injuries, and risk factors for 195 countries and territories and at the subnational level for a subset of countries. Estimates for disability-adjusted life years (DALYs) by cause, age, and sex and healthy life expectancy (HALE) by age and sex are available from the GBD Results Tool for 1990-2016 (quinquennial). Select tables published in The Lancet in September 2017 in "Global, regional, and national disability-adjusted life-years (DALYs) for 333 diseases and injuries and healthy life expectancy (HALE) for 195 countries and territories, 1990–2016: a systematic analysis for the Global Burden of Disease Study 2016" are also available for download via the “Files” tab above.
-
Май 2019Источник: World Health OrganizationЗагружен: KnoemaДата обращения к источнику: 16 мая, 2019ВыбратьNote: All data contained within is provisional. The annual number of cases of measles and rubella officially reported by a member state is only available by July of each following year (through the joint WHO UNICEF annual data collection exercise). “provisional data based on monthly data reported to WHO (Geneva) as of April 2019”. Measles cases are defined as laboratory confirmed, epidemiologically linked, and clinical cases as reported to the World Health Organization. Some countries report cases at irregular intervals, providing multiple months of data in a one month period. Future months are reported as 0 and will be updated as data is available. When data is used in public settings, please acknowledge the data source is the World Health Organization.
-
Апрель 2011Источник: African Development Bank GroupЗагружен: KnoemaДата обращения к источнику: 23 июля, 2018Выбрать
-
Декабрь 2008Источник: Institute for Health Metrics and EvaluationЗагружен: Peter SpeyerВыбратьIHME research, published in the Lancet in 2008. The study, Tracking progress towards universal childhood immunizations and the impact of global initiatives, provides estimates with confidence intervals of the coverage of three-dose diphtheria, tetanus, and pertussis (DTP3) vaccination. The estimates take into account all publicly available data, including data from routine reporting systems and nationally representative surveys.
- E
-
Август 2013Источник: Economic Community of Central African StatesЗагружен: KnoemaДата обращения к источнику: 22 августа, 2013ВыбратьEconomic Community of Central African States Statistics, 2013
-
Сентябрь 2018Источник: Fraser InstituteЗагружен: KnoemaДата обращения к источнику: 02 ноября, 2018ВыбратьData cited at: "Economic Freedom of the World: 2018 Annual Report"@Fraser Institute The economic freedom index measures the degree of economic freedom present in five major areas: [1] Size of Government; [2] Legal System and Security of Property Rights; [3] Sound Money; [4] Freedom to Trade Internationally; [5] Regulation. Within the five major areas, there are 24 components (area) in economic freedom index. Each component and sub-component is placed on a scale from 0 to 10.
-
Декабрь 2015Источник: United Nations Development ProgrammeЗагружен: Misha GusevВыбратьCalculated using Mean Years of Schooling and Expected Years of Schooling.
-
Март 2019Источник: World BankЗагружен: KnoemaДата обращения к источнику: 20 марта, 2019ВыбратьData cited at: The World Bank https://datacatalog.worldbank.org/ Topic:Education Statistics Publication: https://datacatalog.worldbank.org/dataset/education-statistics License: http://creativecommons.org/licenses/by/4.0/ The World Bank EdStats All Indicator Query holds over 4,000 internationally comparable indicators that describe education access, progression, completion, literacy, teachers, population, and expenditures. The indicators cover the education cycle from pre-primary to vocational and tertiary education.
-
Ноябрь 2018Источник: ClimatescopeЗагружен: KnoemaДата обращения к источнику: 27 февраля, 2019ВыбратьWorld: Electricity Prices
-
Декабрь 2016Источник: Food and Agriculture OrganizationЗагружен: KnoemaДата обращения к источнику: 22 марта, 2019Выбрать
-
Декабрь 2017Источник: Food and Agriculture OrganizationЗагружен: KnoemaДата обращения к источнику: 27 мая, 2019ВыбратьGreenhouse Gas (GHG) emissions from burning of savanna consist of methane (CH4) and nitrous oxide (N2O) gases produced from the burning of vegetation biomass in the following five land cover types: Savanna, Woody Savanna, Open Shrublands, Closed Shrublands, and Grasslands. The FAOSTAT emissions database is computed following Tier 1 IPCC 2006 Guidelines for National GHG Inventories (http://www.ipcc-nggip.iges.or.jp/public/2006gl/vol4.html). GHG emissions are provided by country, regions and special groups, with global coverage, relative to the period 1990-present (with annual updates), expressed as Gg CH4, Gg N2O, Gg CO2eq and Gg CO2eq from both CH4 and N2O, by land cover class (savanna, woody savanna, closed shrubland, open shrubland, grassland) and by aggregates (all categories, savanna and woody savanna, closed and open shrubland). Implied emission factors for N2O and CH4 as well activity data (burned area and biomass burned) are also provided.
-
Февраль 2018Источник: Food and Agriculture OrganizationЗагружен: KnoemaДата обращения к источнику: 27 мая, 2019ВыбратьAgriculture Total contains all the emissions produced in the different agricultural emissions sub-domains (enteric fermentation, manure management, rice cultivation, synthetic fertilizers, manure applied to soils, manure left on pastures, crop residues, cultivation of organic soils, burning of crop residues, burning of savanna, energy use), providing a picture of the contribution to the total amount of GHG emissions from agriculture. GHG emissions from agriculture consist of non-CO2 gases, namely methane (CH4) and nitrous oxide (N2O), produced by crop and livestock production and management activities. The FAOSTAT emissions database is computed following Tier 1 IPCC 2006 Guidelines for National GHG Inventories (http://www.ipcc-nggip.iges.or.jp/public/2006gl/index.html). GHG emissions are provided by country, regions and special groups, with global coverage, relative to the period 1961-present (with annual updates) and with projections for 2030 and 2050, expressed as Gg CO2 and CO2eq (from CH4 and N2O), by underlying agricultural emission sub-domain and by aggregate (agriculture total, agriculture total plus energy, agricultural soils).
-
Февраль 2018Источник: Food and Agriculture OrganizationЗагружен: KnoemaДата обращения к источнику: 22 марта, 2019ВыбратьGreenhouse Gas (GHG) emissions from burning crop residues consist of methane (CH4) and nitrous oxide (N2O) gases produced by the combustion of a percentage of crop residues burnt on-site. The mass of fuel available for burning should be estimated taking into account the fractions removed before burning due to animal consumption, decay in the field, and use in other sectors (e.g., biofuel, domestic livestock feed, building materials, etc.). FAOSTAT emission estimates are computed at Tier 1 following the IPCC 2006 Guidelines for National GHG Inventories (http://www.ipcc-nggip.iges.or.jp/public/2006gl/vol4.html). GHG emissions are provided by country, reguions and special groups, with global coverage, relative to the period 1961-present (with annual updates) and with projections for 2030 and 2050, expressed both as Gg CH4, Gg N2O, Gg CO2eq and CO2eq from CH4 and N2O, by crop (maize, rice, sugarcane and wheat) and by aggregates. Implied emission factors for N2O and CH4 as well activity data (biomass burned) are also provided.
-
Февраль 2018Источник: Food and Agriculture OrganizationЗагружен: KnoemaДата обращения к источнику: 27 мая, 2019ВыбратьGreenhouse gas (GHG) emissions from crop residues consist of direct and indirect nitrous oxide (N2O) emissions from nitrogen (N) in crop residues and forage/pasture renewal left on agricultural fields by farmers. Specifically, N2O is produced by microbial processes of nitrification and de-nitrification taking place on the deposition site (direct emissions), and after volatilization/re-deposition and leaching processes (indirect emissions). The FAOSTAT emissions database is computed following Tier 1 IPCC 2006 Guidelines for National GHG Inventories, Vol. 4, Ch. 2 and 11(http://www.ipcc-nggip.iges.or.jp/public/2006gl/vol4.html). GHG emissions are provided as direct, indirect and total by country, regions and special groups, with global coverage, relative to the period 1961-present (with annual updates) and with projections for 2030 and 2050, expressed as Gg N2O and Gg CO2eq, by crop and N content in residues.
-
Февраль 2018Источник: Food and Agriculture OrganizationЗагружен: KnoemaДата обращения к источнику: 22 марта, 2019ВыбратьGreenhouse gas (GHG) emissions from enteric fermentation consist of methane gas produced in digestive systems of ruminants and to a lesser extent of non-ruminants. The FAOSTAT emissions database is computed following Tier 1 IPCC 2006 Guidelines for National GHG Inventories vol. 4, ch. 10 and 11 (http://www.ipcc-nggip.iges.or.jp/public/2006gl/vol4.html). GHG emissions are provided by country, regions and special groups, with global coverage, relative to the period 1961-present (with annual updates) and with projections for 2030 and 2050, expressed both as Gg CH4 and Gg CO2eq, by livestock species (asses, buffaloes, camels, cattle (dairy and non-dairy), goats, horses, llamas, mules, sheep, swine (breeding and market)) and by species aggregates (all animals, camels and llamas, cattle, mules and asses, sheep and goats, swine). Implied emission factor for CH4 and activity data are also provided
-
Февраль 2018Источник: Food and Agriculture OrganizationЗагружен: KnoemaДата обращения к источнику: 22 марта, 2019ВыбратьGHG emissions from manure applied to soils consist of direct and indirect nitrous oxide (N2O) emissions from manure nitrogen (N) added to agricultural soils by farmers. Specifically, N2O is produced by microbial processes of nitrification and de-nitrification taking place on the application site (direct emissions), and after volatilization/re-deposition and leaching processes (indirect emissions). The FAOSTAT emissions database is computed following Tier 1 IPCC 2006 Guidelines for National GHG Inventories vol. 4, ch. 10 and 11 (http://www.ipcc-nggip.iges.or.jp/public/2006gl/vol4.html). GHG emissions are provided as direct, indirect and total by country, regions and special groups, with global coverage, relative to the period 1961-present (with annual updates) and with projections for 2030 and 2050, expressed as Gg N2O and Gg CO2eq, by livestock species (asses, buffaloes, camels, cattle (dairy and non-dairy), chickens (broilers and layers), ducks, goats, horses, llamas, mules, sheep, swine (breeding and market) and turkeys) and by species aggregates (all animals, camels and llamas, cattle, chickens, mules and asses, poultry birds, sheep and goats, swine). Implied emission factor for N2O and activity data (N content in manure) are also provided.
-
Февраль 2018Источник: Food and Agriculture OrganizationЗагружен: KnoemaДата обращения к источнику: 22 марта, 2019ВыбратьGHG emissions from manure left on pastures consist of direct and indirect nitrous oxide (N2O) emissions from manure nitrogen (N) left on pastures by grazing livestock. Specifically, N2O is produced by microbial processes of nitrification and de-nitrification taking place on the deposition site (direct emissions), and after volatilization/re-deposition and leaching processes (indirect emissions). The FAOSTAT emissions database is computed following Tier 1 IPCC 2006 Guidelines for National GHG Inventories vol. 4, ch. 10 and 11 (http://www.ipcc-nggip.iges.or.jp/public/2006gl/vol4.html). GHG emissions are provided by country, regions and special groups, with global coverage, relative to the period 1961-present (with annual updates) and with projections for 2030 and 2050, expressed as direct, indirect and total Gg N2O and Gg CO2eq, by livestock species (asses, buffaloes, camels, cattle (dairy and non-dairy), chickens (broilers and layers), ducks, goats, horses, llamas, mules, sheep, swine (breeding, market), turkeys) and by species aggregates (all animals, camels and llamas, cattle, chickens, mules and asses, poultry birds, sheep and goats, swine). Implied emission factor for N2O and N content in manure are also provided.
-
Февраль 2018Источник: Food and Agriculture OrganizationЗагружен: KnoemaДата обращения к источнику: 22 марта, 2019Выбрать
-
Февраль 2018Источник: Food and Agriculture OrganizationЗагружен: KnoemaДата обращения к источнику: 22 марта, 2019ВыбратьGreenhouse gas (GHG) emissions from synthetic fertilizers consist of nitrous oxide gas from synthetic nitrogen additions to managed soils. Specifically, N2O is produced by microbial processes of nitrification and de-nitrification taking place on the addition site (direct emissions), and after volatilization/re-deposition and leaching processes (indirect emissions). The FAOSTAT emissions database is computed following Tier 1 IPCC 2006 Guidelines for National GHG Inventories vol. 4, ch. 11 (http://www.ipcc-nggip.iges.or.jp/public/2006gl/vol4.html). GHG emissions are provided as direct, indirect and total by country, regions and special groups, with global coverage, relative to the period 1961-present (with annual updates) and with projections for 2030 and 2050, expressed as Gg N2O and Gg CO2eq. Implied emission factor for N2O and activity data (consumption) are also provided.
-
Декабрь 2017Источник: Food and Agriculture OrganizationЗагружен: KnoemaДата обращения к источнику: 27 мая, 2019ВыбратьGreenhouse Gas (GHG) emissions from burning of biomass consist of methane and nitrous oxide gases from biomass combustion of forest land cover classes ‘Humid and Tropical Forest’ and ‘Other Forests’, and of methane, nitrous oxide, and carbon dioxide gases from combustion of organic soils. The FAOSTAT emissions database is computed following Tier 1 IPCC 2006 Guidelines for National GHG Inventories (http://www.ipcc-nggip.iges.or.jp/public/2006gl/vol4.html). GHG emissions are provided by country, with global coverage, relative to the period 1990-present (with annual updates), expressed as Gg CH4, Gg N2O, Gg CO2, Gg CO2eq and Gg CO2eq from both CH4 and N2O, by land cover class (humid tropical forest, other forest, organic soils) and by aggregate (burning - all categories). Implied emission factors for N2O, CH4 and CO2 as well activity data (burned area and biomass burned) are also provided.
-
Декабрь 2017Источник: Food and Agriculture OrganizationЗагружен: KnoemaДата обращения к источнику: 27 мая, 2019ВыбратьGreenhouse gas (GHG) emissions data from cropland are currently limited to emissions from cropland organic soils. They are those associated with carbon losses from drained histosols under cropland. The FAOSTAT emissions database is computed following Tier 1 IPCC 2006 Guidelines for National GHG Inventories (http://www.ipcc-nggip.iges.or.jp/public/2006gl/vol5.html). GHG emissions are provided by country, region and special groups, with global coverage, relative to the period 1990-present (with annual updates), expressed as net emissions/removal Gg CO2 and Gg CO2eq. Implied emission factor for C, net stock change Gg C and activity data (area) are also provided.
-
Февраль 2016Источник: Food and Agriculture OrganizationЗагружен: KnoemaДата обращения к источнику: 27 мая, 2019ВыбратьAnnual net CO2 emission/removal from Forest Land consist of net carbon stock gain/loss in the living biomass pool (aboveground and belowground biomass) associated with Forest and Net Forest Conversion. The FAOSTAT emissions database is computed following Tier 1 IPCC 2006 Guidelines for National GHG Inventories (http://www.ipcc-nggip.iges.or.jp/public/2006gl/index.html) and using area and carbon stocks data compiled by countries in the FAO Global Forest Resource Assessments (http://www.fao.org/forestry/fra/en/). GHG emissions are provided by country, regions and special groups, with global coverage, relative to the period 1990-present (with annual updates), expressed as net stock change Gg C, net emissions/removals Gg CO2 and CO2eq, by forest or net forest conversion and by aggregate (forest land). Implied emission factor for CO2 as well as activity data (area, net area difference, total forest area and carbon stock in living biomass) are also given.
-
Декабрь 2017Источник: Food and Agriculture OrganizationЗагружен: KnoemaДата обращения к источнику: 27 мая, 2019ВыбратьGreenhouse gas (GHG) emissions data from grassland are currently limited to emissions from grassland organic soils. They are those associated with carbon losses from drained histosols under grassland. The FAOSTAT emissions database is computed following Tier 1 IPCC 2006 Guidelines for National GHG Inventories (http://www.ipcc-nggip.iges.or.jp/public/2006gl/vol6.html). GHG emissions are provided by country, region and special groups, with global coverage, relative to the period 1990-present (with annual updates), expressed as net emissions/removal Gg CO2 and Gg CO2eq. Implied emission factor for C, net stock change Gg C and activity data (area) are also provided.
-
Декабрь 2017Источник: Food and Agriculture OrganizationЗагружен: KnoemaДата обращения к источнику: 27 мая, 2019ВыбратьLand Use Total contains all GHG emissions and removals produced in the different Land Use sub-domains, representing the three IPCC Land Use categories: cropland, forest land, and grassland, collectively called emissions/removals from the Forestry and Other Land Use (FOLU) sector. FOLU emissions consist of CO2 (carbon dioxide), CH4 (methane) and N2O (nitrous oxide) associated with land management activities. CO2 emissions/removals are derived from estimated net carbon stock changes in above and below-ground biomass pools of forest land, including forest land converted to other land uses. CH4 and N2O, and additional CO2 emissions are estimated for fires and drainage of organic soils. The FAOSTAT emissions database is computed following Tier 1 IPCC 2006 Guidelines for National GHG Inventories (http://www.ipcc-nggip.iges.or.jp/public/2006gl/index.html). GHG emissions are provided as by country, regions and special groups, with global coverage, relative to the period 1990-present (with annual updates), expressed as Gg CO2eq from CH4 and N2O, net emissions/removals as GG CO2 and Gg CO2eq, by underlying land use emission sub-domain and by aggregate (land use total).
-
Февраль 2019Источник: International Labour OrganizationЗагружен: KnoemaДата обращения к источнику: 15 февраля, 2019ВыбратьThe series is part of the ILO estimates and is harmonized to account for differences in national data and scope of coverage, collection and tabulation methodologies as well as for other country-specific factors. For more information, refer to the ILO estimates and projections methodological note.
-
Февраль 2019Источник: International Labour OrganizationЗагружен: KnoemaДата обращения к источнику: 24 марта, 2019ВыбратьEmployees are all those workers who hold paid employment jobs, which are those where the incumbents hold employment contracts which give them a basic remuneration not directly dependent upon the revenue of the unit for which they work. Data are disaggregated by economic activity according to the latest version of the International Standard Industrial Classification of All Economic Activities (ISIC) available for that year. Economic activity refers to the main activity of the establishment in which a person worked during the reference period and does not depend on the specific duties or functions of the person's job, but on the characteristics of the economic unit in which this person works.
-
Февраль 2019Источник: International Labour OrganizationЗагружен: KnoemaДата обращения к источнику: 15 февраля, 2019ВыбратьThe series is part of the ILO estimates and is harmonized to account for differences in national data and scope of coverage, collection and tabulation methodologies as well as for other country-specific factors. For more information, refer to the ILO estimates and projections methodological note.
-
Май 2019Источник: EurostatЗагружен: KnoemaДата обращения к источнику: 22 мая, 2019ВыбратьNational accounts are a coherent set of macroeconomic indicators, which provide an overall picture of the economic situation and are widely used for economic analysis and forecasting, policy design and policy making. The data presented in this collection are the results of a pilot exercise on the sharing selected main GDP aggregates, population and employment data collected by different international organisations. It wasconducted by the Task Force in International Data Collection (TFIDC) which was established by the Inter-Agency Group on Economic and Financial Statistics (IAG). The goal of this pilot is to develop a set of commonly shared principles and working arrangements for data cooperation that could be implemented by the international agencies. The data sets are an experimental exercise to present national accounts data form various countries across the globe in one coherent folder, but users should be aware that these data are collected and validated by different organisations and not fully harmonised from a methodological point of view. The domain consists of the following collections:
-
Февраль 2019Источник: International Labour OrganizationЗагружен: KnoemaДата обращения к источнику: 15 февраля, 2019ВыбратьThe employed comprise all persons of working age who, during a specified brief period, were in one of the following categories: a) paid employment (whether at work or with a job but not at work); or b) self-employment (whether at work or with an enterprise but not at work). The series is part of the ILO estimates and is harmonized to account for differences in national data and scope of coverage, collection and tabulation methodologies as well as for other country-specific factors. Data for 1991-2016 are estimates while 2017-2021 data are projections. The dataset was updated as of November 2017. For more information, refer to the ILO estimates and projections methodological note.
-
Май 2019Источник: International Labour OrganizationЗагружен: KnoemaДата обращения к источнику: 21 мая, 2019ВыбратьThe employed comprise all persons of working age who, during a specified brief period, were in one of the following categories: a) paid employment (whether at work or with a job but not at work); or b) self-employment (whether at work or with an enterprise but not at work).
-
Февраль 2019Источник: International Labour OrganizationЗагружен: KnoemaДата обращения к источнику: 15 февраля, 2019ВыбратьThe employed comprise all persons of working age who, during a specified brief period, were in the following categories: a) paid employment (whether at work or with a job but not at work); or b) self-employment (whether at work or with an enterprise but not at work). Data are disaggregated by economic activity, which refers to the main activity of the establishment in which a person worked during the reference period and does not depend on the specific duties or functions of the person's job, but on the characteristics of the economic unit in which this person works. The series is part of the ILO estimates and is harmonized to account for differences in national data and scope of coverage, collection and tabulation methodologies as well as for other country-specific factors. Data for 1991-2016 are estimates while 2017-2021 data are projections. The dataset was updated as of November 2017. For more information, refer to the indicator description and the ILO estimates and projections methodological note.
-
Февраль 2019Источник: International Labour OrganizationЗагружен: KnoemaДата обращения к источнику: 15 февраля, 2019ВыбратьThe employed comprise all persons of working age who, during a specified brief period, were in the following categories: a) paid employment (whether at work or with a job but not at work); or b) self-employment (whether at work or with an enterprise but not at work). Data are disaggregated by occupation according to the latest version of the International Standard Classification of Occupations (ISCO). Information on occupation provides a description of the set of tasks and duties which are carried out by, or can be assigned to, one person. The series is part of the ILO estimates and is harmonized to account for differences in national data and scope of coverage, collection and tabulation methodologies as well as for other country-specific factors. Data for 1991-2016 are estimates while 2017-2021 data are projections. The dataset was updated as of November 2017. For more information, refer to the indicator description and the labour force estimates and projections methodological paper.
-
Февраль 2019Источник: International Labour OrganizationЗагружен: KnoemaДата обращения к источнику: 15 февраля, 2019ВыбратьThe employed comprise all persons of working age who, during a specified brief period, were in one of the following categories: a) paid employment (whether at work or with a job but not at work); or b) self-employment (whether at work or with an enterprise but not at work). Data are disaggregated by status in employment according to the latest version of the International Standard Classification of Status in Employment (ICSE-93). Status in employment refers to the type of explicit or implicit contract of employment the person has with other persons or organizations. The basic criteria used to define the groups of the classification are the type of economic risk and the type of authority over establishments and other workers which the job incumbents have or will have. The series is part of the ILO estimates and is harmonized to account for differences in national data and scope of coverage, collection and tabulation methodologies as well as for other country-specific factors. Data for 1991-2016 are estimates while 2017-2021 data are projections. The dataset was updated as of November 2017. For more information, refer to the ILO estimates and projections methodological note.
-
Февраль 2019Источник: International Labour OrganizationЗагружен: KnoemaДата обращения к источнику: 15 февраля, 2019ВыбратьThe series is part of the ILO estimates and is harmonized to account for differences in national data and scope of coverage, collection and tabulation methodologies as well as for other country-specific factors. For more information, refer to the ILO estimates and projections methodological note.
-
Февраль 2019Источник: International Labour OrganizationЗагружен: KnoemaДата обращения к источнику: 15 февраля, 2019ВыбратьThe employment-to-population ratio expresses the number of persons who are employed as a percent of the total working age population. The series is part of the ILO estimates and is harmonized to account for differences in national data and scope of coverage, collection and tabulation methodologies as well as for other country-specific factors. Data for 1991-2016 are estimates while 2017-2021 data are projections. The dataset was updated as of November 2017. For more information, refer to the indicator description and the ILO estimates and projections methodological note.
-
Февраль 2019Источник: International Labour OrganizationЗагружен: KnoemaДата обращения к источнику: 15 февраля, 2019ВыбратьThe series is part of the ILO estimates and is harmonized to account for differences in national data and scope of coverage, collection and tabulation methodologies as well as for other country-specific factors. For more information, refer to the ILO estimates and projections methodological note.
-
Май 2018Источник: Federal Institute for Geosciences and Natural ResourcesЗагружен: KnoemaДата обращения к источнику: 16 мая, 2018Выбрать
-
Март 2019Источник: Organisation for Economic Co-operation and DevelopmentЗагружен: KnoemaДата обращения к источнику: 15 марта, 2019ВыбратьThis dataset presents the number of students enrolled in different education programmes by country of origin and sex.
-
Июль 2018Источник: World BankЗагружен: KnoemaДата обращения к источнику: 11 июля, 2018Выбрать1: Most surveys were administered using the Enterprise Surveys Global Methodology as outlined in the Methodology page, while some others did not strictly adhere to the Enterprise Surveys Global Methodology. For example, for surveys which do not follow the Global Methodology, the Universe under consideration may have consisted of only manufacturing firms or the questionnaire used may have been different from the standard global questionnaire. Data users should exercise caution when comparing raw data and point estimates between surveys that did and did not adhere to the Enterprise Surveys Global Methodology. For surveys which did not adhere to the Global Methodology plus Afghanistan 2008, any inference from one of these surveys is representative only for the data sample itself. 2: Regional and "all countries" averages of indicators are computed by taking a simple average of country-level point estimates. For each economy, only the latest available year of survey data is used in this computation. Only surveys, posted during the years 2009-2017, and adhering to the Enterprise Surveys Global Methodology are used to compute these regional and "all countries" averages. 3: Descriptions of firm subgroup levels, e.g. how the ex post groupings are constructed, are provided in the Indicator Descriptions (PDF, 710KB) document. 4: Statistics derived from less than or equal to five firms are displayed with an "n.a." to maintain confidentiality and should be distinguished from ".." which indicates missing values. Also note for three growth-related indicators under the "Performance" topic, these indicators are not computed when they are derived from less than 30 firms. 5: Standard errors are labeled "n.c.", meaning not computed, for the following: 1) indicators for all surveys that were not conducted using the Enterprise Surveys Global Methodology and 2) for indicator breakdowns by ex post groupings: exporter or ownership type, and gender of the top manager.
-
Январь 2018Источник: Environmental Performance IndexЗагружен: KnoemaДата обращения к источнику: 02 февраля, 2018ВыбратьThe Environmental Performance Index (EPI) is constructed through the calculation and aggregation of 20 indicators reflecting national-level environmental data. These indicators are combined into nine issue categories, each of which fit under one of two overarching objectives. The two objectives that provide the overarching structure of the EPI are Environmental Health and Ecosystem Vitality. Environmental Health measures the protection of human health from environmental harm. Ecosystem Vitality measures ecosystem protection and resource management. These two objectives are further divided into nine issue categories that span high-priority environmental policy issues, including air quality, forests, fisheries, and climate and energy, among others. The issue categories are extensive but not comprehensive. Underlying the nine issue categories are 20 indicators calculated from country-level data and statistics. After more than 15 years of work on environmental performance measurement and six iterations of the EPI, global data are still lacking on a number of key environmental issues. These include: freshwater quality, toxic chemical exposures, municipal solid waste management, nuclear safety, wetlands loss, agricultural soil quality and degradation, recycling rates, adaptation, vulnerability, and resiliency to climate change, desertification.
-
Estimated resident population, Country of birth, Age and sex - as at 30 June 1996 to 2017, AustraliaАпрель 2019Источник: Australian Bureau of StatisticsЗагружен: KnoemaДата обращения к источнику: 05 апреля, 2019ВыбратьThe estimated resident population (ERP) is the official measure of the Australian population. This dataset contains annual ERP by country of birth, age and sex at the Australia level. At the state/territory level it is available for Census years only. Population_Estimates:_Concepts,_Sources_and_Methods_2009
-
Estimated resident population, Country of birth, State/territory, Age and sex - as at 30 June 1996 to 2016, Census years, AustraliaФевраль 2019Источник: Australian Bureau of StatisticsЗагружен: KnoemaДата обращения к источнику: 18 февраля, 2019ВыбратьThe estimated resident population (ERP) is the official measure of the Australian population. This dataset contains annual ERP by country of birth, age and sex at the Australia level. At the state/territory level it is available for Census years only.
-
Сентябрь 2015Источник: Multiple SourcesЗагружен: KnoemaДата обращения к источнику: 10 сентября, 2015Выбрать
-
Октябрь 2015Источник: International Monetary FundЗагружен: KnoemaДата обращения к источнику: 22 октября, 2015ВыбратьRecent exchange rate movements have been unusually large, triggering a debate regarding their likely effects on trade. Historical experience in advanced and emerging market and developing economies suggests that exchange rate movements typically have sizable effects on export and import volumes. A 10 percent real effective depreciation in an economy’s currency is associated with a rise in real net exports of, on average, 1.5 percent of GDP, with substantial cross-country variation around this average. Although these effects fully materialize over a number of years, much of the adjustment occurs in the first year. The boost to exports associated with currency depreciation is found to be largest in countries with initial economic slack and with domestic financial systems that are operating normally. Some evidence suggests that the rise of global value chains has weakened the relationship between exchange rates and trade in intermediate products used as inputs into other economies’ exports. However, the bulk of global trade still consists of conventional trade, and there is little evidence of a general trend toward disconnect between exchange rates and total exports and imports.
-
Июль 2018Источник: United Nations Conference on Trade and DevelopmentЗагружен: KnoemaДата обращения к источнику: 18 января, 2019ВыбратьThis table presents annual statistics on international trade in services of individual economies by trading partner and by 78 selected service categories. In addition, the table contains data for services trade of various groups of economies with world" and for selected principal service categories. The data presented are the result of the common work of UNCTAD, World Trade Organization (WTO) and International Trade Center (ITC).
-
Март 2019Источник: Statistics CanadaЗагружен: KnoemaДата обращения к источнику: 13 марта, 2019Выбрать
-
Ноябрь 2018Источник: Organisation for Economic Co-operation and DevelopmentЗагружен: KnoemaДата обращения к источнику: 26 ноября, 2018ВыбратьAir pollution is considered one of the most pressing environmental and health issues across OECD countries and beyond. According to the World Health Organisation (WHO), exposure to fine particulate matter (PM2.5) has potentially the most significant adverse effects on health compared to other pollutants. PM2.5 can be inhaled and cause serious health problems including both respiratory and cardiovascular disease, having its most severe effects on children and elderly people. Exposure to PM2.5 has been shown to considerably increase the risk of heart disease and stroke in particular. For these reasons, population exposure to (outdoor or ambient) PM2.5 has been identified as an OECD Green Growth headline indicator. The underlying PM2.5 concentrations estimates are taken from van Donkelaar et al. (2016). They have been derived using satellite observations and a chemical transport model, calibrated to global ground-based measurements using Geographically Weighted Regression at 0.01° resolution. The underlying population data, Gridded Population of the World, version 4 (GPWv4) are taken from the Socioeconomic Data and Applications Center (SEDAC) at the NASA. The underlying boundary geometries are taken from the Global Administrative Unit Layers (GAUL) developed by the FAO, and the OECD Territorial Classification, when available. The current version of the database presents much more variation with respect to the previous one. The reason is that the underlying concentration estimates previously included smoothed multi-year averages and interpolations; while in the current version annual concentration estimates are used. Establishing trends of pollution exposure should be done with care, especially at smaller output areas, as their inputs (e.g. underlying data and models) can change from year to year. We recommend using a 3-year moving average for visualisation.
-
Сентябрь 2013Источник: United Nations Conference on Trade and DevelopmentЗагружен: KnoemaДата обращения к источнику: 10 октября, 2013ВыбратьThis table presents information on the external long-term indebtedness of developing economies (as debtors), expressed in millions of dollars, expressed as percentage of total long-term debt, as percentage of debt source and as percentage of region. The table also provides breakdown of public and publicly guaranteed debt by source of lending (as creditors).
-
External trade in goods, main figures, by country/trade region/continent (NOK million) 1988 - 2018, NorwayМай 2019Источник: Statistics NorwayЗагружен: KnoemaДата обращения к источнику: 17 мая, 2019ВыбратьIf a search in the StatBank does not return any result, this does not necessarily mean that there is no trade or that the country code is not valid in the particular period. A zero (0) could also imply that the figures are confidential or that the value is less than half of the unit used. From 2006 on the following countries had their belonging to continent changed - Cyprus from Asia to Europe, and Armenia, Georgia, Kyrgyzstan, Kazakhstan, Tajikistan, Turkmenistan and Uzbekistan from Europe to Asia. The total for Trade are/continent includes this change - while in the selections of countries in the pull-down menu for European/Asian countries it is the present classification that will be shown for the whole time period (Cypros belonging to Europe and the other countries to Asia). Statistics Norway do not publish figures for the trade region previously Comecon after 2011. For more information, see About the statistics Monthly figures are released on the 15th of the month after the observation period (the previous month), or the first subsequent working day. These figures are preliminary. Corresponding yearly figures are published together with the monthly figures for December. With regard to the current year, all the monthly figures are updated in every publication. Final figures for the preceding year are released twice. For the first time in May the following year, while the corrected final figures are published in May one year later. country EU Croatia is included in the trade with the EU from 2014 on. Palestine (2013-) Previously: West Bank/Gaza Stripe (2001-2012)
-
External trade in goods, main figures, by country/trade region/continent (NOK million) 1988M01 - 2019M02, NorwayМай 2019Источник: Statistics NorwayЗагружен: KnoemaДата обращения к источнику: 17 мая, 2019ВыбратьIf a search in the StatBank does not return any result, this does not necessarily mean that there is no trade or that the country code is not valid in the particular period. A zero (0) could also imply that the figures are confidential or that the value is less than half of the unit used. From 2006 on the following countries had their belonging to continent changed - Cyprus from Asia to Europe, and Armenia, Georgia, Kyrgyzstan, Kazakhstan, Tajikistan, Turkmenistan and Uzbekistan from Europe to Asia. The total for Trade are/continent includes this change - while in the selections of countries in the pull-down menu for European/Asian countries it is the present classification that will be shown for the whole time period (Cypros belonging to Europe and the other countries to Asia). Statistics Norway do not publish figures for the trade region previously Comecon after 2011. For more information, see About the statistics Monthly figures are released on the 15th of the month after the observation period (the previous month), or the first subsequent working day. These figures are preliminary. Corresponding yearly figures are published together with the monthly figures for December. With regard to the current year, all the monthly figures are updated in every publication. Final figures for the preceding year are released twice. For the first time in May the following year, while the corrected final figures are published in May one year later. country EU Croatia is included in the trade with the EU from 2014 on. Palestine (2013-) Previously: West Bank/Gaza Stripe (2001-2012)
-
Май 2019Источник: State Statistical Office, Republic of North MacedoniaЗагружен: KnoemaДата обращения к источнику: 11 мая, 2019ВыбратьMethodological explanationsSymbols used Source: State Statistical Office Year 2018M12 preliminary data
-
Май 2019Источник: State Statistical Office, Republic of North MacedoniaЗагружен: KnoemaДата обращения к источнику: 11 мая, 2019ВыбратьMethodological explanationsSymbols used Source: State Statistical Office Year 2018 preliminary data
- F
-
Май 2018Источник: Food and Agriculture OrganizationЗагружен: KnoemaДата обращения к источнику: 22 марта, 2019ВыбратьThe dataset includes data on gross and net production indices for various food and agriculture aggregates expressed in both totals and per capita.
-
Сентябрь 2018Источник: Food and Agriculture OrganizationЗагружен: KnoemaДата обращения к источнику: 31 октября, 2018Выбрать1.Following the recommendation of experts gathered in the Committee on World Food Security (CFS) Round Table on hunger measurement, hosted at FAO headquarters in September 2011, an initial set of indicators aiming to capture various aspects of food insecurity is presented here. 2.The choice of the indicators has been informed by expert judgment and the availability of data with sufficient coverage to enable comparisons across regions and over time. Many of these indicators are produced and published elsewhere by FAO and other international organizations. They are reported here in a single database with the aim of building a wide food security information system. More indicators will be added to this set as more data will become available. Note: Data represent values for time periods (1999-2001,2000-02,2005-07) and is shown as data for the last year of time period 2001, 2002,2007
-
Июнь 2012Источник: Food and Agriculture OrganizationЗагружен: KnoemaДата обращения к источнику: 18 июля, 2012ВыбратьThis dataset represents Food Consumption, Food Production and Trade by various Food items. Note: data represent values for time periods (1990-1992, 1995-97, 2000-02, 2005-07) and is shown as data for the last year of time period (1992, 1997, 2002, 2007).
-
Октябрь 2018Источник: Food and Agriculture OrganizationЗагружен: KnoemaДата обращения к источнику: 20 ноября, 2018ВыбратьThe Price domain of FAOSTAT contains data on prices received by farmers (called Producer prices) for primary crops, live animals, livestock primary products as collected at the point of initial sale (prices paid at the farm-gate). Data are provided for over 160 countries and for some 200 commodities. The Price domain provides price data in three units: i) Local Currency Units (LCU) ii) Standard Local Currency (SLC) iii) US Dollars.
-
Ноябрь 2018Источник: Food and Agriculture OrganizationЗагружен: KnoemaДата обращения к источнику: 22 марта, 2019ВыбратьValue of gross production has been compiled by multiplying gross production in physical terms by output prices at farm gate. Thus, value of production measures production in monetary terms at the farm gate level. Since intermediate uses within the agricultural sector (seed and feed) have not been subtracted from production data, this value of production aggregate refers to the notion of "gross production". Value of gross production is provided in both current and constant terms and is expressed in US dollars and Standard Local Currency (SLC). The current value of production measures value in the prices relating to the period being measured. Thus, it represents the market value of food and agricultural products at the time they were produced. Knowing this figure is helpful in understanding exactly what was happening within a given economy at that point in time. Often, this information can help explain economic trends that emerged in later periods and why they took place. Value of production in constant terms is derived using the average prices of a selected year or years, known as the base period. Constant price series can be used to show how the quantity or volume of products has changed, and are often referred to as volume measures. The ratio of the current and constant price series gives a measure of price movements. US dollar figures for value of gross production are converted from local currencies using official exchange rates as prevailing in the respective years. The SLC of a country is the local currency prevailing in the latest year. Expressing data series in one uniform currency is useful because it avoids the influence of revaluation in local currency, if any, on value of production
-
Август 2018Источник: Food and Agriculture OrganizationЗагружен: KnoemaДата обращения к источнику: 27 мая, 2019ВыбратьThe Fertilizers by Product dataset contains information on product amounts for the Production, Trade, Agriculture Use and Other Uses of chemical and mineral fertilizers products, over the time series 2002-present. The fertilizer statistics data are validated separately for a set of over thirty individual products. Both straight and compound fertilizers are included.
-
Апрель 2019Источник: Organisation for Economic Co-operation and DevelopmentЗагружен: KnoemaДата обращения к источнику: 17 апреля, 2019Выбрать
-
Февраль 2018Источник: Organisation for Economic Co-operation and DevelopmentЗагружен: KnoemaДата обращения к источнику: 26 июня, 2018ВыбратьFDI data are based on statistics provided by 35 OECD member countries and by Lithuania. BMD4: OECD Benchmark Definition of Foreign Direct Investment - 4th Edition
-
Март 2019Источник: Organisation for Economic Co-operation and DevelopmentЗагружен: KnoemaДата обращения к источнику: 05 марта, 2019Выбрать
-
Июнь 2018Источник: Organisation for Economic Co-operation and DevelopmentЗагружен: KnoemaДата обращения к источнику: 02 июля, 2018Выбрать
-
Апрель 2019Источник: Organisation for Economic Co-operation and DevelopmentЗагружен: KnoemaДата обращения к источнику: 16 апреля, 2019Выбрать
-
Февраль 2019Источник: International Labour OrganizationЗагружен: KnoemaДата обращения к источнику: 15 февраля, 2019ВыбратьThe labour force comprises all persons of working age who furnish the supply of labour for the production of goods and services during a specified time-reference period. It refers to the sum of all persons of working age who are employed and those who are unemployed. The working-age population is commonly defined as persons aged 15 years and older, but this varies from country to country. The series is part of the ILO estimates and is harmonized to account for differences in national data and scope of coverage, collection and tabulation methodologies as well as for other country-specific factors. Data for 1990-2015 are estimates while 2016-2030 data are projections. The dataset was updated as of July 2017. For more information, refer to the ILO estimates and projections methodological note.
-
Декабрь 2017Источник: Food and Agriculture OrganizationЗагружен: KnoemaДата обращения к источнику: 22 марта, 2019ВыбратьThe dataset contains data on Import and Export Value (expressed in 1000 USD) for a selected list of fertilizers, from 1961 on wards. Country and country aggregate data are available. The fertilizers covered are: Nitrogenous fertilizers; Phosphate fertilizers; Potash fertilizers; Fertilizers Manufactured, nes; Fertilizers, Organic; Natural Phosphates; Natural Potassic Salts; Natural Sodium Nitrate.
-
Октябрь 2018Источник: International Federation of Association FootballЗагружен: KnoemaДата обращения к источнику: 25 марта, 2019ВыбратьMonthly updates of FIFA World Football Men's Ranking
-
Financial deficit by rural / urban areas (% of population not covered due to financial resource deficit) (%)Август 2018Источник: International Labour OrganizationЗагружен: KnoemaДата обращения к источнику: 31 августа, 2018ВыбратьThis indicator is a proxy for the quality of health care. It represents the percentage of the population without access to health care due to financial resource deficit. The threshold for having sufficient financial resources is US$239 per person per year. A higher figure indicates worse levels of coverage. To estimate the quality of health care, this indicator uses as a proxy the relative difference between per capita health expenditure in a given country and its median value in countries with a low level of vulnerability.To establish whether a country is spending 'enough' or has 'enough' key health workers, it is necessary first to define what constitutes 'enough', i.e. set a threshold against which a country's performance can be compared. Opinions differ on what constitutes 'enough' in these contexts, not least because it is likely to be a moving target, influenced by prevailing health issues, demography etc. The ILO's approach for measuring financial deficit is to: (i) calculate the median expenditure on health (excluding OOP) in low-vulnerability countries, then (ii) for each country, compare spending against this median. In 2014, the median in low-vulnerability countries was US$239. For example, a country spending 50% less than the median in low-vulnerability countries has a financial deficit of 50%. This is one of five indicators measuring key dimensions of deficits in health care access and coverage. For analytical purposes the full set of indicators should be considered together.
-
Май 2019Источник: International Monetary FundЗагружен: KnoemaДата обращения к источнику: 24 мая, 2019ВыбратьThe Financial Soundness Indicators (FSIs) were developed by the IMF, together with the international community, with aim of supporting analysis and assessing strengths and vulnerabilities of financial systems. The Statistics Department of the IMF, disseminates data and metadata on selected FSIs provided by participating countries. For a description of the various FSIs, as well as the consolidation basis, consolidation adjustments, and accounting rules followed, please refer to the concepts and definitions document in the document tab. Reporting countries compile FSI data using different methodologies, which may also vary for different points in time for the same country. Users are advised to consult the accompanying metadata to conduct more meaning cross-country comparisons or to assess the evolution of a given FSI for any of the countries.
-
Май 2019Источник: International Monetary FundЗагружен: KnoemaДата обращения к источнику: 04 мая, 2019ВыбратьThe Reporting entities dataset provides information on the structure, size, and coverage of the financial institutions that are used for compiling financial soundness indicators. It provides a better understanding of the structure of the reporting entities in terms of the type of institution, number of entities, size of assets, and type of control. Reporting entities are domestically incorporated entities but are divided into two: domestically controlled and foreign controlled. The concepts of residency criterion and control are determined based on FSI Guide methodology which is in line with international best practices such as Systems of National Accounts. Data on reporting entities cover the branches, subsidiaries and the value of asset for both domestically and foreign controlled entities resident in the reporting country together their resident and non-resident subsidiaries.
-
Март 2019Источник: Statistics FinlandЗагружен: KnoemaДата обращения к источнику: 23 марта, 2019ВыбратьData cited at: Statistics Finland http://www.stat.fi/index_en.html Publication: 004 -- International trade in services by region, 1 000 000 euros http://pxnet2.stat.fi/PXWeb/pxweb/en/StatFin/StatFin__kan__tpulk/statfin_tpulk_pxt_004.px License: http://creativecommons.org/licenses/by/4.0/ The statistics on international trade in goods and services cover international trade in balance of payments terms on the quarterly level. The statistics form a link for goods trade in customs and balance of payments terms, describe the breakdown of quarterly trade in services, and indicate the total exports of goods and services by area. . = Category not applicable. .. = Data not available or too uncertain for presentation, or subject to secrecy. Description of statistics Concepts and definitionsRegion Region and statesYear Year.Data Import The value of imports, 1 000 000 euros.Export The value of exports, 1 000 000 euros.
-
Март 2018Источник: Statistics FinlandЗагружен: KnoemaДата обращения к источнику: 29 ноября, 2018ВыбратьData cited at: Statistics Finland http://www.stat.fi/index_en.html Publication: 008 -- Nationality according to age and sex by region in 1990 to 2017 http://pxnet2.stat.fi/PXWeb/pxweb/en/StatFin/StatFin__vrm__vaerak/statfin_vaerak_pxt_008.px License: http://creativecommons.org/licenses/by/4.0/ Concepts and definitions Description Quality description These statistics apply the regional division of 1 January 2018 to the whole time series. Population statistics from 1750 to 2000 have been digitised into PDF format in the National Library's Doria service. Publications on Population structure in Doria (in Finnish) Publications on Vital statistics in Doria (in Finnish) Publications on Population censuses in Doria (in Finnish)Nationality If a person has two nationalities and one of them is Finnish, he/she will be included in statistics as a Finnish national. The used classification of continents is the classification of Eurostat, where Cyprus and Turkey belong to Europe. Citizens of non-autonomous states are summed under the mother country.Nationality Czech Republic Czech Republic + Former CzechoslovakiaSudan Sudan + Former Sudan
-
Март 2018Источник: Statistics FinlandЗагружен: KnoemaДата обращения к источнику: 29 ноября, 2018ВыбратьData cited at: Statistics Finland http://www.stat.fi/index_en.html Publication: 009 -- Finnish citizens with dual nationality by age and second nationality in 2000 to 2017 http://pxnet2.stat.fi/PXWeb/pxweb/en/StatFin/StatFin__vrm__vaerak/statfin_vaerak_pxt_009.px License: http://creativecommons.org/licenses/by/4.0/ Concepts and definitions Description Quality description Population statistics from 1750 to 2000 have been digitised into PDF format in the National Library's Doria service. Publications on Population structure in Doria (in Finnish) Publications on Vital statistics in Doria (in Finnish) Publications on Population censuses in Doria (in Finnish) Second nationality If a person has two nationalities and one of them is Finnish, he/she will be included in statistics as a Finnish national. Second nationality Czech Republic Czech Republic + Former Czechoslovakia Sudan Sudan + Former Sudan
-
Сентябрь 2017Источник: United Nations World Food ProgrammeЗагружен: KnoemaДата обращения к источнику: 21 декабря, 2017ВыбратьIRMA is computed on one representative ton of the food aid basket the user has selected. The "representativity" of the ton comes from the fact that the shares of the commodities are the same as those in the total selected food basket. Therefore it can be used for comparisons among food aid baskets of different size and in understanding how much of their difference in nutritional content is due to the absolute value in metric tons of the donations and how much is due to the nutritional qualities of food delivered. IRMA, IRMAs and IRMAt provide only information on their 'nutritional potential' of meeting average requirements.
-
Сентябрь 2017Источник: United Nations World Food ProgrammeЗагружен: KnoemaДата обращения к источнику: 21 декабря, 2017ВыбратьThe energy intake of a human being is the only one among the nutrients that cannot in the short run be renounced without putting at immediate risk the possibility of survival itself. A lack of other nutrients increases susceptibility to infections and slows cognitive development and growth, contributing to poorer school performance and reduced work productivity. These effects are largely irreversible and long term, particularly when they occur at a young age. For these reasons, the IRMAs computation takes the content of Energy as a benchmark to compare with the other nutrients' content. For the calculation of IRMAs, we start with the IRMA values for each nutrient. IRMA of a nutrient counts the number of average individuals that could potentially be satisfied by the nutrient contained in a ton of food aid. IRMA, IRMAs and IRMAt provide only information on their 'nutritional potential' of meeting average requirements.
-
Сентябрь 2017Источник: United Nations World Food ProgrammeЗагружен: KnoemaДата обращения к источнику: 21 декабря, 2017ВыбратьIRMAt (Individual Requirements Met on Average, Total) can be considered an alternative measure for food aid deliveries. By knowing how many tons of which commodity are contained in the food aid basket, it is easy to compute how many micrograms of nutrients there are in the overall basket. But, a measure like that would not be easy to interpret. Furthermore, each nutrient is measured in a different unit (for example, vitamin C is measured in micrograms and fat is measured in grams). IRMAt 'standardizes' the nutritional content of food aid by taking it as a percentage of human nutritional requirements. IRMAt of a nutrient is nothing but the number of individual requirements that could potentially be met on an annual basis by the total food aid deliveries selected. IRMAt values are descriptive of a food aid basket and are dependent on the absolute value in tonnage. They give information that reflects both nutritional content and the size of the food aid deliveries. From this point of view IRMAt can be considered a unit of measurement for food aid flows: it measures food aid basket by the number of average individuals that its nutritional content could potentially satisfy. IRMA, IRMAs and IRMAt provide only information on their 'nutritional potential' of meeting average requirements.
-
Декабрь 2017Источник: Food and Agriculture OrganizationЗагружен: KnoemaДата обращения к источнику: 22 марта, 2019ВыбратьFood Balance Sheet presents a comprehensive picture of the pattern of a country's food supply during a specified reference period. The food balance sheet shows for each food item - i.e. each primary commodity and a number of processed commodities potentially available for human consumption - the sources of supply and its utilization. The total quantity of foodstuffs produced in a country added to the total quantity imported and adjusted to any change in stocks that may have occurred since the beginning of the reference period gives the supply available during that period. On the utilization side a distinction is made between the quantities exported, fed to livestock, used for seed, put to manufacture for food use and non-food uses, losses during storage and transportation, and food supplies available for human consumption. The per caput supply of each such food item available for human consumption is then obtained by dividing the respective quantity by the related data on the population actually partaking of it. Data on per caput food supplies are expressed in terms of quantity and - by applying appropriate food composition factors for all primary and processed products - also in terms of caloric value and protein and fat content.
-
Январь 2018Источник: Food and Agriculture OrganizationЗагружен: KnoemaДата обращения к источнику: 22 марта, 2019ВыбратьCommodity balances show balances of food and agricultural commodities in a standardized form. The scope of standardization is to present these data in a less detailed form for a selected number of commodities without causing any significant loss of the basic variables monitoring the agricultural sector. The selected commodities include the equivalents of their derived products falling in the same commodity group, but exclude the equivalents of by-products and derived commodities, which through processing, change their nature and become part of different commodity groups. A number of commodity/item aggregates have been included to offer synthetic information. Some of these are included with the aim of simplifying the extraction of all component commodities. Data shown in the item aggregates represent the sum of the component commodities as presented in this domain (standardized form). Commodity coverage: The commodity list in this domain has been generally confined to primary commodities - except for sugar, oils and fats and beverages. Whenever possible trade in processed commodities is expressed in the originating primary commodity equivalent. Rice is expressed in milled equivalent.
-
Сентябрь 2017Источник: KnoemaЗагружен: KnoemaДата обращения к источнику: 11 сентября, 2017ВыбратьCollect food prices data in your country and earn up to $120 every month.We are looking for data collectors who will go to the specific markets weekly, collect data on food prices for about 25 items and submit them into our system.
-
Январь 2017Источник: KnoemaЗагружен: KnoemaДата обращения к источнику: 03 января, 2017ВыбратьVersion - 2 Note: Added new location
-
Февраль 2018Источник: Food and Agriculture OrganizationЗагружен: KnoemaДата обращения к источнику: 22 марта, 2019ВыбратьFood supply data is some of the most important data in FAOSTAT. In fact, this data is for the basis for estimation of global and national undernourishment assessment, when it is combined with parameters and other data sets. This data has been the foundation of food balance sheets ever since they were first constructed. The data is accessed by both business and governments for economic analysis and policy setting, as well as being used by the academic community.
-
Январь 2018Источник: Food and Agriculture OrganizationЗагружен: KnoemaДата обращения к источнику: 22 марта, 2019ВыбратьFood supply data is some of the most important data in FAOSTAT. In fact, this data is for the basis for estimation of global and national undernourishment assessment, when it is combined with parameters and other data sets. This data has been the foundation of food balance sheets ever since they were first constructed. The data is accessed by both business and governments for economic analysis and policy setting, as well as being used by the academic community.
-
Сентябрь 2014Источник: Organisation for Economic Co-operation and DevelopmentЗагружен: Pallavi SДата обращения к источнику: 04 октября, 2014ВыбратьThe number of students enrolled refers to the count of students studying in the reference period. Each student enrolled in the education programmes covered by the corresponding category is counted once and only once. National data collection systems permitting, the statistics reflect the number of students enrolled at the beginning of the school / academic year. Preferably, the end (or near-end) of the first month of the school / academic year is chosen (special arrangements are made for part-year students who may not start studies at the beginning of the school year). Students are classified as foreign students (non-citizens) if they are not citizens of the country in which the data are collected. While pragmatic and operational, this classification is inappropriate for capturing student mobility because of differing national policies regarding the naturalisation of immigrants. Countries that have lower propensity to grant permanent residence to its immigrant populations are likely to report second generation immigrants as foreign students. Therefore, for student mobility and bilateral comparisons, interpretations of data based on the concept of foreign students should be made with caution. Students are classified as international students if they left their country of origin and moved to another country for the purpose of study. Depending on country-specific immigration legislation, mobility arrangements, and data availability, international students may be defined as students who are not permanent or usual residents of their country of study or alternatively as students who obtained their prior education in a different country, including another EU country.
-
Август 2018Источник: United Nations Conference on Trade and DevelopmentЗагружен: KnoemaДата обращения к источнику: 31 октября, 2018Выбрать
-
Август 2018Источник: United Nations Conference on Trade and DevelopmentЗагружен: KnoemaДата обращения к источнику: 13 августа, 2018ВыбратьThis dataset contains information on foreign direct investment (FDI) inward and outward flows and stock, expressed in millions of dollars. These figures correspond to the Statistical Annexes of the UNCTAD World Investment Report. The World Investment Report, which is released in June each year (t), contains annual data up to the year before (t-1). However, at the time of publication, the data for the most recent year are still preliminary and are subject to revision by the national authorities. When they revise data, UNCTAD updates its database accordingly. The dataset also presents the following indicators: the percentage share of each economy/group in the world, and percentage ratios of FDI to GDP. Foreign direct investment (FDI) is an investment made by a resident enterprise in one economy (direct investor or parent enterprise) with the objective of establishing a lasting interest in an enterprise that is resident in an another economy (direct investment enterprise or foreign affiliate). The lasting interest implies the existence of a long-term relationship between the direct investor and the direct investment enterprise and a significant degree of influence on the management of the enterprise. The ownership of 10% or more of the voting power of a direct investment enterprise by a direct investor is evidence of such a relationship. FDI flows comprise mainly three components:acquisition or disposal of equity capital. FDI includes the initial equity transaction that meets the 10% threshold and all subsequent financial transactions and positions between the direct investor and the direct investment enterprise;reinvestment of earnings which are not distributed as dividends;inter-company debt. FDI flows are transactions recorded during the reference period (typically year or quarter). FDI stocks are the accumulated value held at the end of the reference period (typically year or quarter). In 2014, many countries implemented the new guidelines for the compilation of FDI data based on the Sixth edition of the Balance of Payments and International Investment Position Manual (BPM6) and the Fourth edition of OECD Benchmark Definition of Foreign Direct Investment (BD4). One of the major changes introduced in BPM6 and BD4 is the presentation of FDI statistics on an asset/liability basis instead of the directional principle (as recommended by the previous editions of these guidelines). On an asset/liability basis, direct investment statistics are organized according to whether the investment relates to an asset or a liability for the reporting country. Under the directional principle, the direct investment statistics are organized according to the direction of the investment for the reporting country - either inward or outward. The two presentations differ in their treatment of reverse investment (reverse investment is when an affiliate provides loans to its parent). Under the directional presentation, reverse investment is subtracted to derive the total outward or inward investment of the reporting economy. Therefore, FDI statistics on an asset/liability basis tends to be higher than those under the directional principle, but such is not always the case. While the presentation on an asset/liability basis is appropriate for macroeconomic analysis (i.e. the impact on the balance of payments), the presentation on directional principle is more appropriate to assist policymakers and government officials to formulate investment policies. This is because the presentation of the FDI data on directional basis reflects the direction of influence by the foreign direct investor underlying the direct investment: inward or outward direct investment. FDI data in this table are on directional principle, unless otherwise indicated
-
Август 2018Источник: General Authority for Statistics, Kingdom of Saudi ArabiaЗагружен: Shakthi KrishnanДата обращения к источнику: 10 сентября, 2018Выбрать
-
Май 2019Источник: Ministry of Finance, R.O.C. (Taiwan)Загружен: KnoemaДата обращения к источнику: 28 мая, 2019ВыбратьThe statistics cover only goods exported to and imported from the economic territory of the Republic of China (Taiwan, Penghu, Kinmen and Matsu). Fish caught and sold overseas by national fishing vessels are also included in exports.Total Exports = Exports + Re-exports, Total Imports = Imports + Re-imports.Exports/re-exports is based on F.O.B. value. Imports/re-imports is based on C.I.F value.The same currency exchange rate from NT dollar to US dollar is applied to either imports/re-imports or exports/re-exports, which is the midpoint between selling and buying rates announced by Customs every 10 days in a month for filling Customs declaration purpose.Notes: 1. Prior to 2015, the value of exports includes bunker oil for the use of national vessels, aircrafts and other means of conveyance engaged in international trade. 2. Prior to 1998, the value of exports and imports by Continent/Country excludes re-exports and re-imports. 2019 values are year to date
-
Май 2019Источник: U.S. Census BureauЗагружен: KnoemaДата обращения к источнику: 08 мая, 2019Выбрать
-
Май 2018Источник: World Trade OrganizationЗагружен: KnoemaДата обращения к источнику: 23 апреля, 2019ВыбратьWorld Bank/WTO/UNCTAD - Annual Trade in Services Dataset
-
Апрель 2019Источник: Bahrain Open Data PortalЗагружен: KnoemaДата обращения к источнику: 22 апреля, 2019Выбрать
-
Апрель 2019Источник: Kuwait Central Statistical BureauЗагружен: KnoemaДата обращения к источнику: 08 мая, 2019Выбрать
-
Ноябрь 2018Источник: Federal Competitiveness and Statistics Authority, United Arab EmiratesЗагружен: KnoemaДата обращения к источнику: 13 ноября, 2018ВыбратьData cited at: https://uaenumbers.fcsa.gov.ae/UAEITSS2018U3
-
Январь 2019Источник: Uganda Bureau of StatisticsЗагружен: KnoemaДата обращения к источнику: 19 марта, 2019Выбрать
-
Декабрь 2017Источник: Food and Agriculture OrganizationЗагружен: KnoemaДата обращения к источнику: 27 мая, 2019ВыбратьThe database contains data on the production and trade in roundwood and primary wood and paper products for all countries and territories in the world. The main types of primary forest products included in are: roundwood, sawnwood, wood-based panels, pulp, and paper and paperboard. These products are detailed further. The definitions are available. The database contains details of the following topics: - Roundwood removals (production) by type of wood and assortment - Production and trade in roundwood, woodfuel and other basic products - Industrial roundwood by assortment and species - Sawnwood, panels and other primary products - Pulp and paper & paperboard. More detailed information on wood products, including definitions, can be found at http://www.fao.org/forestry/statistics/80572/en/
-
Май 2018Источник: Food and Agriculture OrganizationЗагружен: KnoemaДата обращения к источнику: 22 марта, 2019Выбрать
-
Декабрь 2016Источник: Carbon Dioxide Information Analysis CenterЗагружен: KnoemaДата обращения к источнику: 17 мая, 2017ВыбратьWorld and National CO2 Emissions from Fossil-Fuel Burning, Cement Manufacture, and Gas Flaring. Source: Tom Boden, Gregg Marland and Bob Andres (Oak Ridge National Laboratory)
-
Июль 2015Источник: African Development Bank GroupЗагружен: KnoemaДата обращения к источнику: 06 августа, 2015ВыбратьThe AfDB Statistics Department and the Fragile States Unit have compiled this data set from various sources (the World Bank, WHO, IMF, and many others)
-
Апрель 2019Источник: Fund for PeaceЗагружен: KnoemaДата обращения к источнику: 15 мая, 2019ВыбратьThe FSI focuses on the indicators of risk and is based on thousands of articles and reports that are processed by our CAST Software from electronically available sources. Measures of fragility, like Demographic Pressures,Refugees and IDPs and etc., have been scaled on 0 to 10 where 10 is highest fragility and 0 no fragility.
-
Декабрь 2018Источник: Freedom HouseЗагружен: KnoemaДата обращения к источнику: 07 марта, 2019ВыбратьFreedom in the World is Freedom House’s flagship annual report, assessing the condition of political rights and civil liberties around the world. It is composed of numerical ratings and supporting descriptive texts for many countries. Freedom in the World has been published since 1973, allowing Freedom House to track global trends in freedom over more than 40 years. It has become the most widely read and cited report of its kind, used on a regular basis by policymakers, journalists, academics, activists, and many others.
-
Апрель 2017Источник: Freedom HouseЗагружен: KnoemaДата обращения к источнику: 09 октября, 2018ВыбратьVariables converted from character to numeric as follow:Variables under consideration are top 3 vars i.e. Status, print and Broadcast 1 = Free (F) 2 = Partly Free (PF) 3 = Not Free (NF) Under source it values are present like: "F" , "PF" and "NF" Note:- Date range has been considered as follow: Jan.1981-Aug.1982 is considered as 1982 Aug.1982-Nov.1983 is considered as 1983 Nov.1983-Nov.1984 is considered as 1984 Nov.1984-Nov.1985 is considered as 1985 Nov.1985-Nov.1986 is considered as 1986 Nov.1986-Nov.1987 is considered as 1987 About Freedom of the press: Freedom of the Press, an annual report on media independence around the world which assesses the degree of print, broadcast, and digital media freedom in 199 countries and territories. Published since 1980, it provides numerical scores and country narratives evaluating the legal environment for the media, political pressures that influence reporting, and economic factors that affect access to news and information. Freedom of the Press is the most comprehensive data set available on global media freedom and serves as a key resource for policymakers, international institutions, journalists, activists, and scholars worldwide.
- G
-
Сентябрь 2017Источник: Institute for Health Metrics and EvaluationЗагружен: KnoemaДата обращения к источнику: 14 ноября, 2017ВыбратьThe Global Burden of Disease Study 2015 (GBD 2015), coordinated by the Institute for Health Metrics and Evaluation (IHME), estimated the burden of diseases, injuries, and risk factors at the global, regional, national, territorial, and, for a subset of countries, subnational level. As part of this study, estimates for obesity and overweight prevalence and the disease burden attributable to high body mass index (BMI) were produced by sex, age group, and year for 195 countries and territories. Estimates for high BMI-attributable deaths, DALYs, and other measures (1990-2015) are available from the GBD Results Tool. Files available in this record include obesity and overweight prevalence estimates for 1980-2015. Study results were published in The New England Journal of Medicine in June 2017 in "Health Effects of Overweight and Obesity in 195 Countries over 25 Years."
-
Сентябрь 2017Источник: Institute for Health Metrics and EvaluationЗагружен: KnoemaДата обращения к источнику: 08 ноября, 2017ВыбратьThe Global Burden of Disease Study 2015 (GBD 2015), coordinated by the Institute for Health Metrics and Evaluation (IHME), estimated the burden of diseases, injuries, and risk factors at the global, regional, national, territorial, and, for a subset of countries, subnational level. As part of this study, estimates for daily smoking prevalence and smoking-attributable mortality and disease burden, as measured by disability-adjusted life years (DALYs), were produced by sex, age group, and year for 195 countries and territories. Estimates for deaths and DALYs (1990-2015) are available from the GBD Results Tool. Files available in this record include daily smoking prevalence (1980-2015) and annualized rate of change estimates. Study results were published in The Lancet in April 2017 in "Smoking prevalence and attributable disease burden in 195 countries and territories, 1990–2015: a systematic analysis from the Global Burden of Disease Study 2015." Date ranges have been considered as follows: 1990-2015 as 1990 1990-2005 as 2005 2005-2015 as 2015
-
Сентябрь 2017Источник: Institute for Health Metrics and EvaluationЗагружен: KnoemaДата обращения к источнику: 27 октября, 2017ВыбратьThe Global Burden of Disease Study 2015 (GBD 2015), coordinated by the Institute for Health Metrics and Evaluation (IHME), estimated the burden of diseases, injuries, and risk factors at the global, regional, national, territorial, and, for a subset of countries, subnational level. This dataset measures progress towards the Millennium Development Goal 5 (MDG 5) target of a 75% reduction in the maternal mortality ratio between 1990 and 2015. Maternal mortality ratio estimates for 21 regions, 195 countries and territories and 4 United Kingdom subnational units for 1990-2015 (quinquennial) are available by age and cause from the GBD Results Tool. Files available in this record include tables published in The Lancet in October 2016 in "Global, regional, and national levels of maternal mortality, 1990–2015: a systematic analysis for the Global Burden of Disease Study 2015.
-
Ноябрь 2018Источник: Institute for Health Metrics and EvaluationЗагружен: KnoemaДата обращения к источнику: 23 ноября, 2018ВыбратьThe Global Burden of Disease Study 2017 (GBD 2017), coordinated by the Institute for Health Metrics and Evaluation (IHME), estimated the burden of diseases, injuries, and risk factors for 195 countries and territories and at the subnational level for a subset of countries. Developed by GBD researchers and used to help produce these estimates, the Socio-demographic Index (SDI) is a composite indicator of development status strongly correlated with health outcomes. It is the geometric mean of 0 to 1 indices of total fertility rate under the age of 25 (TFU25), mean education for those ages 15 and older (EDU15+), and lag distributed income (LDI) per capita. As a composite, a location with an SDI of 0 would have a theoretical minimum level of development relevant to health, while a location with an SDI of 1 would have a theoretical maximum level. This dataset provides tables with SDI values for all estimated GBD 2017 locations for 1950–2017 and groupings by location based on their 2017 values.
-
Май 2019Источник: Global Database of Events, Language, and ToneЗагружен: KnoemaДата обращения к источнику: 22 мая, 2019ВыбратьData cited at: Global Database of Events, Language, and Tone The GDELT Event Database records over 300 categories of physical activities around the world, from riots and protests to peace appeals and diplomatic exchanges, georeferenced to the city or mountain top, across the entire planet dating back to January 1, 1979 and updated every 15 minutes. Essentially it takes a sentence like "The United States criticized Russia yesterday for deploying its troops in Crimea, in which a recent clash with its soldiers left 10 civilians injured" and transforms this blurb of unstructured text into three structured database entries, recording US CRITICIZES RUSSIA, RUSSIA TROOP-DEPLOY UKRAINE (CRIMEA), and RUSSIA MATERIAL-CONFLICT CIVILIANS (CRIMEA). Nearly 60 attributes are captured for each event, including the approximate location of the action and those involved. This translates the textual descriptions of world events captured in the news media into codified entries in a grand "global spreadsheet."
-
Май 2019Источник: EurostatЗагружен: KnoemaДата обращения к источнику: 23 мая, 2019ВыбратьNational accounts are a coherent set of macroeconomic indicators, which provide an overall picture of the economic situation and are widely used for economic analysis and forecasting, policy design and policy making. The data presented in this collection are the results of a pilot exercise on the sharing selected main GDP aggregates, population and employment data collected by different international organisations. It wasconducted by the Task Force in International Data Collection (TFIDC) which was established by the Inter-Agency Group on Economic and Financial Statistics (IAG). The goal of this pilot is to develop a set of commonly shared principles and working arrangements for data cooperation that could be implemented by the international agencies. The data sets are an experimental exercise to present national accounts data form various countries across the globe in one coherent folder, but users should be aware that these data are collected and validated by different organisations and not fully harmonised from a methodological point of view. The domain consists of the following collections:
-
Январь 2017Источник: International Monetary FundЗагружен: KnoemaДата обращения к источнику: 09 февраля, 2017ВыбратьThis dataset includes gender inequality and development indices.
-
Апрель 2019Источник: World BankЗагружен: KnoemaДата обращения к источнику: 01 мая, 2019ВыбратьData cited at: The World Bank https://datacatalog.worldbank.org/ Topic: Gender Statistics Publication: https://datacatalog.worldbank.org/dataset/gender-statistics License: http://creativecommons.org/licenses/by/4.0/
-
Апрель 2019Источник: Organisation for Economic Co-operation and DevelopmentЗагружен: KnoemaДата обращения к источнику: 12 апреля, 2019ВыбратьThe GID-DB is a database providing researchers and policymakers with key data on gender-based discrimination in social institutions. This data helps analyse women’s empowerment and understand gender gaps in other key areas of development.Covering 180 countries and territories, the GID-DB contains comprehensive information on legal, cultural and traditional practices that discriminate against women and girls.
-
Февраль 2019Источник: Organisation for Economic Co-operation and DevelopmentЗагружен: KnoemaДата обращения к источнику: 28 февраля, 2019Выбрать
-
Март 2019Источник: Organisation for Economic Co-operation and DevelopmentЗагружен: KnoemaДата обращения к источнику: 05 марта, 2019ВыбратьThis table provides information on the main relevant indicators. The data have mainly been supplied by the World Bank, and cover, where available: -Current Gross National Income (GNI) in US $ millions; -GNI per capita (US $); -Population; -Energy use as kilogram of oil per capita; -Average Life Expectancy of Adults; and -Adult Literacy Rate as a percentage of the country population. Data for Sudan include South Sudan, with the exception of total population, which is reported separately.
-
Февраль 2019Источник: Organisation for Economic Co-operation and DevelopmentЗагружен: KnoemaДата обращения к источнику: 27 февраля, 2019ВыбратьBilateral ODA commitments by purpose. Data cover the years 2005 to 2009. Amounts are expressed in USD million. The sectoral distribution of bilateral ODA commitments refers to the economic sector of destination (i.e. the specific area of the recipient's economic or social structure whose development is, or is intended to be fostered by the aid), rather than to the type of goods or services provided. These are aggregates of individual projects notified under the Creditor Reporting System, supplemented by reporting on the sectoral distribution of technical co-operation, and on actual disbursements of food and emergency aid.
-
Октябрь 2015Источник: HelpAge InternationalЗагружен: KnoemaДата обращения к источнику: 16 октября, 2015ВыбратьThe aim of the Index is both to capture the multidimensional nature of the quality of life and wellbeing of older people, and to provide a means by which to measure performance and promote improvements. We have chosen 13 different indicators for the four key domains of Income security, Health status, Capability, and Enabling environment. Domain 1: Income security The income security domain assesses people's access to a sufficient amount of income, and the capacity to use it independently, in order to meet basic needs in older age. Domain 2: Health status The three indicators used for the health domain provide information about physical and psychological wellbeing. Domain 3: Capability The employment and education indicators in this domain look at different aspects of the empowerment of older people. Domain 4: Enabling environment This domain uses data from Gallup World View to assess older people's perception of social connectedness, safety, civic freedom and access to public transport - issues older people have singled out as particularly important.
-
Март 2018Источник: Food and Agriculture OrganizationЗагружен: KnoemaДата обращения к источнику: 28 марта, 2018ВыбратьThis database contains statistics on production volume and value by species, country or area, fishing area and culture environment
-
Июль 2011Источник: World BankЗагружен: KnoemaДата обращения к источнику: 21 сентября, 2017ВыбратьData cited at: The World Bank https://datacatalog.worldbank.org/ Topic: Global Bilateral Migration Database Publication: https://datacatalog.worldbank.org/dataset/global-bilateral-migration-database License: http://creativecommons.org/licenses/by/4.0/ Global Bilateral Migration Database: Global matrices of bilateral migrant stocks spanning the period 1960-2000, disaggregated by gender and based primarily on the foreign-born concept are presented. Over one thousand census and population register records are combined to construct decennial matrices corresponding to the last five completed census rounds. For the first time, a comprehensive picture of bilateral global migration over the last half of the twentieth century emerges. The data reveal that the global migrant stock increased from 92 to 165 million between 1960 and 2000. South-North migration is the fastest growing component of international migration in both absolute and relative terms. The United States remains the most important migrant destination in the world, home to one fifth of the world’s migrants and the top destination for migrants from no less than sixty sending countries. Migration to Western Europe remains largely from elsewhere in Europe. The oil-rich Persian Gulf countries emerge as important destinations for migrants from the Middle East, North Africa and South and South-East Asia. Finally, although the global migrant stock is still predominantly male, the proportion of women increased noticeably between 1960 and 2000.
-
Декабрь 2018Источник: TRACE InternationalЗагружен: KnoemaДата обращения к источнику: 30 января, 2019Выбрать'The TRACE Matrix measures business bribery risk in all countries. Developed in collaboration with RAND Corporation, the TRACE Matrix provides the business community with a powerful new tool for anti-bribery risk assessment. It assesses countries across four domains – Business Interactions with Government, Anti-bribery Laws and Enforcement, Government and Civil Service Transparency, and the Capacity for Civil Society Oversight, including the role of the media – as well as nine sub-domains. Business interactions with government includes the sub-domains of “contact with government,” “expectation of paying bribes” and “regulatory burden.” These indicators capture aspects of the “touches with government” that TRACE identified as very important for business bribery through regulatory and business interviews they conducted. Anti-corruption laws enacted by a country and information about enforcement of those laws. Government and civil service transparency, which includes indicators concerning whether government budgets are publicly available and whether there are regulations addressing conflicts of interest for civil servants. Information concerning the extent of press freedom and social development, both of which serve as indicators of a robust civil society that can provide government oversight. The overall country risk score is a combined and weighted score of four domains. For each of these four "domains" (and related sub-domains), the TRACE Matrix aggregates relevant data obtained from leading public interest and international organizations, including the United Nations, the World Bank and the World Economic Forum. Based on statistical analysis of this information, each country is assigned not only an overall score between 1 and 100—with 100 representing the greatest risk—but also scores for each of the four domains and nine sub-domains.'
-
Март 2018Источник: Food and Agriculture OrganizationЗагружен: KnoemaДата обращения к источнику: 11 апреля, 2018ВыбратьContains the volume of fish catches landed by country or territory of capture, by species or a higher taxonomic level, by FAO major fishing areas, and year for all commercial, industrial, recreational and subsistence purpose
-
Декабрь 2018Источник: Global Carbon AtlasЗагружен: KnoemaДата обращения к источнику: 29 марта, 2019ВыбратьData cited at: Boden et al. (2017), UNFCCC (2018), BP (2018)
-
Ноябрь 2017Источник: Food and Agriculture OrganizationЗагружен: KnoemaДата обращения к источнику: 22 ноября, 2017ВыбратьThis database contains statistics on the annual production of fishery commodities and imports and exports of fishery commodities by country and commodities in terms of volume and value from 1976.
-
Июль 2017Источник: International Telecommunication UnionЗагружен: Shakthi KrishnanДата обращения к источнику: 13 сентября, 2017ВыбратьThe Global Cybersecurity Index (GCI) is a survey that measures the commitment of Member States to cybersecurity in order to raise awareness. The GCI revolves around the ITU Global Cybersecurity Agenda (GCA) and its five pillars (legal, technical, organizational, capacity building and cooperation). For each of these pillars, questions were developed to assess commitment. Through consultation with a group of experts, these questions were weighted in order to arrive at an overall GCI score. The survey was administered through an online platform through which supporting evidence was also collected. One-hundred and thirty-four Member States responded to the survey throughout 2016. Member States who did not respond were invited to validate responses determined from open-source research. As such, the GCI results reported herein cover all 193 ITU Member States. The 2017 publication of the GCI continues to show the commitment to cybersecurity of countries around the world. The overall picture shows improvement and strengthening of all five elements of the cybersecurity agenda in various countries in all regions. However, there is space for further improvement in cooperation at all levels, capacity building and organizational measures. As well, the gap in the level of cybersecurity engagement between different regions is still present and visible. The level of development of the different pillars varies from country to country in the regions, and while commitment in Europe remains very high in the legal and technical fields in particular, the challenging situation in the Africa and Americas regions shows the need for continued engagement and support. In addition to providing the GCI score, this report also provides a set of illustrative practices that give insight into the achievements of certain countries.
-
Февраль 2017Источник: Global Democracy RankingЗагружен: KnoemaДата обращения к источнику: 21 сентября, 2017ВыбратьThe Democracy Ranking 2016 compares the development of quality of democracy in 112 countries during the years 2011-2012 with. It is based on the following dimensions: politics (weighted with 50%), economy (10%), ecology and environment (10%), gender equality (10%), health and health status (10%), and knowledge (10%). The possible values that a country can achieve go from 1 (minimum) to 100 (maximum) (the entire scale is thus 1-100). Rank change: + sign shows improvement in rank and - sign shows deterioration in rank
-
Global Development Assistance for Health, Government, Prepaid Private, and Out-of-Pocket Health SpendingНоябрь 2018Источник: Institute for Health Metrics and EvaluationЗагружен: KnoemaДата обращения к источнику: 30 ноября, 2018ВыбратьResearch by the Global Burden of Disease Health Financing Collaborator Network produced retrospective national health spending estimates for 1995-2016 for 184 countries. The estimates cover total health spending, and health spending disaggregated by source into government spending, out-of-pocket, prepaid private, and development assistance for health. National health spending by source, including development assistance for health, was estimated based on a diverse set of data, including program reports, budget data, national estimates, and 964 National Health Accounts. The resulting estimates were used to help produce forecasted health spending estimates for. Results of the study were published in The Lancet in April 2017 in "Evolution and patterns of global health financing 1995–2016: development assistance for health, and government, prepaid private, and out-of-pocket health spending in 184 countries."
-
Декабрь 2011Источник: Global Facility for Disaster Reduction and RecoveryЗагружен: KnoemaВыбратьContains outcomes of post-disaster damage, loss, and needs assessments carried out by various international organizations following the Damage and Loss Assessment (DaLA) and/or Post-Disaster Needs Assessment (PDNA) methodologies.
-
Октябрь 2018Источник: United Nations Department of Economic and Social AffairsЗагружен: KnoemaДата обращения к источнику: 01 марта, 2019ВыбратьProject LINK is an international collaborative research group for econometric modelling, coordinated jointly by the Development Policy and Analysis Division of UN/DESA and the University of Toronto. Each year, a UN/DESA Expert Group Meeting on the World Economy, also known as the Project LINK Meeting, is held in October to discuss the world economic outlook. The meeting is participated in by a wide range of experts from academia, economic research institutions and international economic organizations as well as colleagues from the five regional commissions: Economic Commission for Africa (ECA), Economic Commission for Europe (ECE), Economic Commission for Latin America and the Caribbean (ECLAC), Economic and Social Commission for Asia and the Pacific (ESCAP) and Economic and Social Commission for Western Asia (ESCWA).
-
Апрель 2018Источник: United Nations Statistics DivisionЗагружен: KnoemaДата обращения к источнику: 21 ноября, 2018ВыбратьEnvironmental Indicators disseminate global environment statistics on ten indicator themes compiled from a wide range of data sources. The themes and indicator tables were selected based on the current demands for international environmental statistics and the availability of internationally comparable data. Indicator tables, charts and maps with relatively good quality and coverage across countries, as well as links to other international sources, are provided under each theme. Statistics on Water and Waste are based on official statistics supplied by national statistical offices and/or ministries of environment (or equivalent institutions) in response to the biennial UNSD/UNEP Questionnaire on Environment Statistics, complemented with comparable statistics from OECD and Eurostat, and water resources data from FAO Aqua stat. Statistics on other themes were compiled by UNSD from other international sources. In a few cases, UNSD has made some calculations in order to derive the indicators. However, generally no adjustments have been made to the values received from the source. UNSD is not responsible for the quality, completeness/availability, and validity of the data. Environment statistics is still in an early stage of development in many countries, and data are often sparse. The indicators selected here are those of relatively good quality and geographic coverage. Information on data quality and comparability is given at the end of each table together with other important metadata.
-
Ноябрь 2018Источник: Institute for Health Metrics and EvaluationЗагружен: KnoemaДата обращения к источнику: 23 ноября, 2018ВыбратьResearch by the Global Burden of Disease Health Financing Collaborator Network produced projected health spending estimates for 2016-2040 for 188 countries. The estimates cover total health spending, and health spending disaggregated by source into government spending, out-of-pocket, prepaid private, and development assistance for health. GDP and all-sector government spending were extracted for 1980–2015 and used with retrospective health spending estimates for 1995-2015 to forecast GDP, all-sector government spending, and health spending through 2040. Results of the study were published in The Lancet in April 2018 in "Trends in future health financing and coverage: future health spending and universal health coverage in 188 countries,."
-
Март 2019Источник: World BankЗагружен: KnoemaДата обращения к источнику: 20 марта, 2019ВыбратьData cited at: The World Bank https://datacatalog.worldbank.org/ Topic: Global Financial Development Publication: https://datacatalog.worldbank.org/dataset/global-financial-development License: http://creativecommons.org/licenses/by/4.0/ The Global Financial Development Database is an extensive dataset of financial system characteristics for 206 economies. The database includes measures of (1) size of financial institutions and markets (financial depth), (2) degree to which individuals can and do use financial services (access), (3) efficiency of financial intermediaries and markets in intermediating resources and facilitating financial transactions (efficiency), and (4) stability of financial institutions and markets (stability).For a complete description of the dataset and a discussion of the underlying literature, see: Martin Cihak; Asli Demirguc-Kunt; Erik Feyen; and Ross Levine, 2012. "Benchmarking Financial Systems Around the World." World Bank Policy Research Working Paper 6175, World Bank, Washington, D.C.
-
Март 2019Источник: World BankЗагружен: KnoemaДата обращения к источнику: 20 марта, 2019ВыбратьData cited at: The World Bank https://datacatalog.worldbank.org/ Topic: Global Financial Inclusion (Global Findex) Database Publication: https://datacatalog.worldbank.org/dataset/global-financial-inclusion-global-findex-database License: http://creativecommons.org/licenses/by/4.0/ The Global Financial Inclusion Database provides 850+ country-level indicators of financial inclusion summarized for all adults and disaggregated by key demographic characteristics-gender, age, education, income, employment status and rural residence. Covering more than 140 economies, the indicators of financial inclusion measure how people save, borrow, make payments and manage risk. The reference citation for the data is: Demirgüç-Kunt, Asli, Leora Klapper, Dorothe Singer, Saniya Ansar, and Jake Hess. 2018. The Global Findex Database 2017: Measuring Financial Inclusion and the Fintech Revolution. World Bank: Washington, DC.
-
Октябрь 2018Источник: World BankЗагружен: KnoemaДата обращения к источнику: 14 ноября, 2018ВыбратьFinancial inclusion is critical in reducing poverty and achieving inclusive economic growth. When people can participate in the financial system, they are better able to start and expand businesses, invest in their children’s education, and absorb financial shocks. Yet prior to 2011, little was known about the extent of financial inclusion and the degree to which such groups as the poor, women, and rural residents were excluded from formal financial systems. The dataset help us to know about how adults around the world manage their day-to-day finances, the Global Findex allows policy makers, researchers, businesses, and development practitioners to track how the use of financial services has changed over time. The database can also be used to identify gaps in access to the formal financial system and design policies to expand financial inclusion.
-
Март 2018Источник: Food and Agriculture OrganizationЗагружен: KnoemaДата обращения к источнику: 11 апреля, 2018ВыбратьContains global production statistics (capture and aquaculture). This database contains the volume of aquatic species caught by country or area, by species items, by FAO major fishing areas, and year, for all commercial, industrial, recreational and subsistence purposes. The harvest from mariculture, aquaculture and other kinds of fish farming is also included
-
Январь 2014Источник: OxfamЗагружен: KnoemaДата обращения к источнику: 30 мая, 2014ВыбратьAround the world, one in eight people go to bed hungry every night, even though there is enough food for everyone. Our graph illustrates how overconsumption, misuse of resources and waste are common elements of a system that leaves hundreds of millions without enough to eat.
-
Сентябрь 2015Источник: Food and Agriculture OrganizationЗагружен: KnoemaДата обращения к источнику: 05 октября, 2015ВыбратьDescriptionThe Global Forest Resources Assessment 2015 (FRA 2015) is the most comprehensive assessment of forests and forestry to date - not only in terms of the number of countries and people involved - but also in terms of scope. It examines the current status and recent trends for about 90 variables covering the extent, condition, uses and values of forests and other wooded land, with the aim of assessing all benefits from forest resources. Information has been collated from 233 countries and territories for four points in time: 1990, 2000, 2005 and 2010. The results are presented according to the seven thematic elements of sustainable forest management. FAO worked closely with countries and specialists in the design and implementation of FRA 2010 - through regular contact, expert consultations, training for national correspondents and ten regional and subregional workshops. More than 900 contributors were involved, including 178 officially nominated national correspondents and their teams. The outcome is better data, a transparent reporting process and enhanced national capacity in developing countries for data analysis and reporting. The final report of FRA 2010 was published at the start of the latest biennial meeting of the FAO' Committee on Forestry and World Forest Week, in Rome.
-
Ноябрь 2018Источник: Emission Database for Global Atmospheric ResearchЗагружен: KnoemaДата обращения к источнику: 14 февраля, 2019ВыбратьDirect greenhouse gases: Carbon Dioxide (CO2), Methane (CH4), Nitrous Oxide (N2O), Hydrofluorocarbons (HFC-23, 32, 125, 134a, 143a, 152a, 227ea, 236fa, 245fa, 365mfc, 43-10-mee), Perfluorocarbons (PFCs: CF4, C2F6, C3F8, c-C4F8, C4F10, C5F12, C6F14, C7F16), Sulfur Hexafluoride (SF6), Nitrogen Trifluoride (NF3) and Sulfuryl Fluoride (SO2F2). Emissions are calculated by individual countries using country-specific information. The countries are organized in different world regions for illustration purposes. Emissions of some small countries are presented together with other countries depending on country definition and availability of activity statistics. Source: European Commission, Joint Research Centre (JRC)/PBL Netherlands Environmental Assessment Agency.
-
Сентябрь 2018Источник: Dual Citizen LLCЗагружен: KnoemaДата обращения к источнику: 21 сентября, 2018ВыбратьThe performance index of the 2018 GGEI is defined by 20 underlying indicators, each contained within one of the four main dimensions of leadership & climate change, efficiency sectors, markets & investment and the environment. For more detail on our approach to aggregating these diverse data sources to define the composite indicators in the GGEI and its four main dimensions, as well as our approach to data selection, weighting and other issues associated with creating an index, please visit the Methodology section.
-
Октябрь 2017Источник: Emission Database for Global Atmospheric ResearchЗагружен: KnoemaДата обращения к источнику: 10 января, 2018ВыбратьEmissions are calculated for the following substances: 1) Direct greenhouse gases: Carbon Dioxide (CO2), Methane (CH4), Nitrous Oxide (N2O), Hydrofluorocarbons (HFC-23, 32, 125, 134a, 143a, 152a, 227ea, 236fa, 245fa, 365mfc, 43-10-mee), Perfluorocarbons (PFCs: CF4, C2F6, C3F8, c-C4F8, C4F10, C5F12, C6F14, C7F16), Sulfur Hexafluoride (SF6), Nitrogen Trifluoride (NF3) and Sulfuryl Fluoride (SO2F2); 2) Ozone precursor gases: Carbon Monoxide (CO), Nitrogen Oxides (NOx), Non-Methane Volatile Organic Compounds (NMVOC) and Methane (CH4). 3) Acidifying gases: Ammonia (NH3), Nitrogen oxides (NOx) and Sulfur Dioxide (SO2). 4) Primary particulates: Fine Particulate Matter (PM10) - Carbonaceous speciation (BC , OC) is under progress. 5) Stratospheric Ozone Depleting Substances: Chlorofluorocarbons (CFC-11, 12, 113, 114, 115), Halons (1211, 1301, 2402), Hydrochlorofluorocarbons (HCFC-22, 124, 141b, 142b), Carbon Tetrachloride (CCl4), Methyl Bromide (CH3Br) and Methyl Chloroform (CH3CCl2). Emissions (EM) for a country C are calculated for each compound x on an annual basis (y) and sector wise (for i sectors, multiplying on the one hand the country-specific activity data (AD), quantifying the human activity for each of the i sectors, with the mix of j technologies (TECH) for each sector i, and with their abatement percentage by one of the k end-of-pipe (EOP) measures for each technology j, and on the other hand the country-specific emission factor (EF) for each sector i and technology j with relative reduction (RED) of the uncontrolled emission by installed abatement measure k. Emissions in are calculated by individual countries using country-specific information. The countries are organized in different world regions for illustration purposes. Emissions of some small countries are presented together with other countries depending on country definition and availability of activity statistics.
-
Март 2019Источник: World Health OrganizationЗагружен: KnoemaДата обращения к источнику: 18 марта, 2019ВыбратьThe GHO data provides access to indicators on priority health topics including mortality and burden of diseases, the Millennium Development Goals (child nutrition, child health, maternal and reproductive health, immunization, HIV/AIDS, tuberculosis, malaria, neglected diseases, water and sanitation), non communicable diseases and risk factors, epidemic-prone diseases, health systems, environmental health, violence and injuries, equity among others.
-
Октябрь 2018Источник: International Food Policy Research InstituteЗагружен: KnoemaДата обращения к источнику: 29 октября, 2018ВыбратьGlobal Hunger Index, 2018 The Global Hunger Index (GHI) is a tool designed to comprehensively measure and track hunger globally, regionally, and by country. Each year, the International Food Policy Research Institute (IFPRI) calculates GHI scores in order to assess progress, or the lack thereof, in decreasing hunger. The GHI is designed to raise awareness and understanding of regional and country differences in the struggle against hunger. Since 2015, GHI scores have been calculated using a revised and improved formula. The revision replaces child underweight, previously the sole indicator of child under-nutrition, with two indicators of child under-nutrition—child wasting and child stunting—which are equally weighted in the GHI calculation. The revised formula also standardizes each of the component indicators to balance their contribution to the overall index and to changes in the GHI scores over time. GHI scores are calculated using a three-step process that draws on available data from various sources to capture the multidimensional nature of hunger: 1. Undernourishment: The share of the population that is undernourished (that is, whose caloric intake is insufficient). 2. Child wasting and stunting: The share of children under the age of five who are wasted (that is, who have low weight for their height, reflecting acute under-nutrition). 3.Child Stunting: The share of children under the age of five who are stunted (that is, who have low height for their age, reflecting chronic under-nutrition). 4. Child Mortality: The mortality rate of children under the age of five (in part, a reflection of the fatal mix of inadequate nutrition and unhealthy environments). Note: Values for the years are taken as per below table.1Global Hunger Index Scores2Proportion of Undernourished in the Population (%)3Prevalence of Wasting in Children Under Five Years(%)4Prevalence of Stunting in Children Under Five Years (%)5Prevalence of underweight in children under five years (%) Date for above indicators are taken as per below year ranges. 1 2 3 4 5 Date Range Date Range Date Range Date Range Date Range 2018 2013-2017 2018 2015-2017 2018 2013-2017 2018 2013-2017 2012 2009-2013 2017 2012-2016 2017 2014-2016 2017 2012-2016 2017 2012-2016 2011 2008-2012 2015 2010-2016 2015 2014-2016 2015 2012-2016 2015 2012-2016 2010 2005-2010 2014 2009-2013 2013 2014-2016 2013 2010-2014 2013 2010-2014 2009 2004-2009 2013 2008-2012 2012 2011-2013 2010 2008-2012 2010 2008-2012 2008 2003-2008 2012 2005-2010 2011 2010-2012 2008 2006-2010 2008 2006-2010 2007 2002-2007 2011 2004-2009 2010 2009-2011 2005 2003-2007 2005 2003-2007 2006 2001-2006 2010 2008-2012 2009 2005-2007 2000 1998-2002 2000 1998-2002 2005 2003-2007 2009 2002-2007 2008 2007-2009 1995 1993-1997 1995 1993-1997 2004 2000-2005 2008 2006-2010 2007 2003-2005 1992 1990-1994 1992 1990-1994 2003 1999-2003 2005 2003-2007 2006 2002-2004 1990 1988-1992 1990 1988-1992 2000 1998-2002 2001 1994-1998 2005 2004-2006 1997 1993-1998 2000 1998-2002 2004 2001-2003 1995 1993-1997 1996 1988-1992 2003 2000-2002 1990 1988-1992 1995 1993-1997 2000 1999-2001 1980 1977-1982 1992 1990-1994 1997 1995-1997 1990 1988-1992 1995 1994-1996 1992 1991-1993 1990 1990-1992 1980 1979-1981 6. "Under-five Mortality Rate(%)" year range has not been specified in source. GHI Severity Scale ≤ 9.9 low 10.0–19.9 moderate 20.0–34.9 serious 35.0–49.9 alarming 50.0 ≤ extremely alarming
-
Ноябрь 2018Источник: International Telecommunication UnionЗагружен: KnoemaДата обращения к источнику: 17 января, 2019Выбрать
-
Июль 2018Источник: Global Innovation IndexЗагружен: KnoemaДата обращения к источнику: 02 августа, 2018ВыбратьThe Global Innovation Index (GII) provides detailed metrics about the innovation performance of 126 countries which represent 90.8% of the world’s population and 96.3% of global GDP. Its 80 indicators explore a broad vision of innovation, including political environment, education, infrastructure and business sophistication. The GII 2018 marks the 11th edition of the GII, and the beginning of its second decade providing data and insights gathered from tracking innovation across the globe. This year’s edition, is dedicated to the theme of Energizing the World with Innovation. It analyses the energy innovation landscape of the next decade and identifies possible breakthroughs in fields such as energy production, storage, distribution, and consumption. It also looks at how breakthrough innovation occurs at the grassroots level and describes how small-scale renewable systems are on the rise.
-
Август 2018Источник: Internal Displacement Monitoring CentreЗагружен: KnoemaДата обращения к источнику: 29 августа, 2018ВыбратьGlobal Internal Displacement Database (GIDD) aims to provide comprehensive information on internal displacement worldwide. It covers all countries and territories for which IDMC has obtained data on situations of internal displacement, and provides data on situations of internal displacement associated with conflict and generalized violence (2014-2015), displacement associated with sudden-onset natural hazard-related disasters (2008-2015).
-
Август 2018Источник: Material FlowsЗагружен: KnoemaДата обращения к источнику: 10 мая, 2019Выбрать
-
Сентябрь 2018Источник: Oxford Poverty & Human Development InitiativeЗагружен: KnoemaДата обращения к источнику: 17 января, 2019ВыбратьThe global Multidimensional Poverty Index (MPI) is an international measure of acute poverty covering over 100 developing countries. It complements traditional income-based poverty measures by capturing the severe deprivations that each person faces at the same time with respect to education, health and living standards. The MPI assesses poverty at the individual level. If someone is deprived in a third or more of ten (weighted) indicators (see left), the global index identifies them as ‘MPI poor’, and the extent – or intensity – of their poverty is measured by the number of deprivations they are experiencing. The MPI can be used to create a comprehensive picture of people living in poverty, and permits comparisons both across countries, regions and the world and within countries by ethnic group, urban/rural location, as well as other key household and community characteristics. This makes it invaluable as an analytical tool to identify the most vulnerable people – the poorest among the poor, revealing poverty patterns within countries and over time, enabling policy makers to target resources and design policies more effectively. The global MPI was developed by OPHI with the UN Development Programme (UNDP) for inclusion in UNDP’s flagship Human Development Report in 2010. It has been published in the HDR ever since.
-
Июнь 2018Источник: Institute for Economics and PeaceЗагружен: KnoemaДата обращения к источнику: 10 июля, 2018ВыбратьData cited at: Institute for Economics and Peace The Global Peace Index 2018 report finds that the global level of peace has deteriorated by 0.27% over the last year. This is the fourth successive year of deterioration, finding that 92 countries have deteriorated, while 71 countries have improved. The report reveals a world in which tensions, conflicts and crises that have emerged over the past decade remain unresolved, causing a gradual, sustained decline in global levels of peacefulness.
-
Май 2019Источник: GlobalPetrolPrices.comЗагружен: KnoemaДата обращения к источнику: 28 мая, 2019ВыбратьData cited at: Global Petrol Prices web site - https://www.globalpetrolprices.com/ License: https://creativecommons.org/licenses/by-nc/4.0/ Data is getting collected Every Tuesday evening from the Global Petrol Prices website. Weekly Average data is available from 28-Dec-2015 onward. Monthly average price is available for the period of January, 2013 - July, 2013
-
Май 2014Источник: Institute for Health Metrics and EvaluationЗагружен: Kirill KosenkovДата обращения к источнику: 27 августа, 2015ВыбратьGlobal, regional, and national prevalence of overweight and obesity in children and adults during 1980–2013. Comparable estimates based on systematically identified surveys, reports, and published studies (n=1769) that included data for height and weight, both through physical measurements and self-reports, using mixed effects linear regression to correct for bias in self-reports. Data for prevalence of obesity and overweight by age, sex, country, and year (n=19 244) obtained with a spatiotemporal Gaussian process regression model to estimate prevalence with 95% uncertainty intervals (UIs). Research by the staff of the Institute for Health Metrics and Evalutaion with co-authors. Published online 28 May 2014, "The Lancet" Volume 384, No. 9945, p766–781. DOI: http://dx.doi.org/10.1016/S0140-6736(14)60460-8
-
Декабрь 2018Источник: World Health OrganizationЗагружен: KnoemaДата обращения к источнику: 22 января, 2019ВыбратьNote: The dataset has been collected from "Global status report on road safety 2018". For this report, 2018 data were used for the review of vehicle standards; 2017 data were used for the review of legislation, road standards and post-crash care; fatality estimates were based on data from 2016. The Global status report on road safety 2018, launched by WHO in December 2018, highlights that the number of annual road traffic deaths has reached 1.35 million. Road traffic injuries are now the leading killer of people aged 5-29 years. The burden is disproportionately borne by pedestrians, cyclists and motorcyclists, in particular those living in developing countries. The report suggests that the price paid for mobility is too high, especially because proven measures exist. These include strategies to address speed and drinking and driving, among other behaviors; safer infrastructure like dedicated lanes for cyclists and motorcyclists; improved vehicle standards such as those that mandate electronic stability control; and enhanced post-crash care. Drastic action is needed to put these measures in place to meet any future global target that might be set and save lives.
-
Декабрь 2014Источник: World Health OrganizationЗагружен: KnoemaДата обращения к источнику: 06 июня, 2018ВыбратьThe Global status report on violence prevention 2014, which reflects data from 133 countries, is the first report of its kind to assess national efforts to address interpersonal violence, namely child maltreatment, youth violence, intimate partner and sexual violence, and elder abuse. Jointly published by WHO, the United Nations Development Programme, and the United Nations Office on Drugs and Crime, the report reviews the current status of violence prevention efforts in countries, and calls for a scaling up of violence prevention programmes; stronger legislation and enforcement of laws relevant for violence prevention; and enhanced services for victims of violence.
-
Апрель 2014Источник: United Nations Office on Drugs and CrimeЗагружен: KnoemaДата обращения к источнику: 20 мая, 2016ВыбратьIntentional homicide is defined as unlawful death purposefully inflicted on a person by another person
-
Ноябрь 2018Источник: Institute for Economics and PeaceЗагружен: KnoemaДата обращения к источнику: 21 февраля, 2019ВыбратьData cited at: Institute for Economics and Peace The Global Terrorism Index (GTI) is a comprehensive study which accounts for the direct and indirect impact of terrorism in 163 countries in terms of its effect on lives lost, injuries, property damage and the psychological aftereffects of terrorism. This study covers 99.6 per cent of the world’s population. It aggregates the most authoritative data source on terrorism today, the Global Terrorism Database (GTD) collated by the National Consortium for the Study of Terrorism and Responses to Terrorism (START) into a composite score in order to provide an ordinal ranking of nations on the negative impact of terrorism. The GTD is unique in that it consists of systematically and comprehensively coded data on domestic as well as international terrorist incidents and now includes more than 140,000 cases. Note: "Change in score values" have been calculated for 2015 by score in 2015 minus score in 2014 (Score_2015-Score_2014). For rest of the years according to source.
-
Январь 2017Источник: U.S. Geological SurveyЗагружен: KnoemaДата обращения к источнику: 14 декабря, 2017Выбрать
-
Август 2018Источник: United Nations Conference on Trade and DevelopmentЗагружен: KnoemaДата обращения к источнику: 21 августа, 2018ВыбратьThis dataset shows indicators of trade balances as the following: - Normalized trade balance, - Trade balance as percentage of imports and, - Trade balance as percentage of nominal gross domestic product (GDP). Normalized trade balance (NTB) of goods and services is defined as the trade balance (total exports less total imports) divided by the total trade (exports plus imports). NTB=(EX-IM)/EX+IM)
-
Август 2018Источник: United Nations Conference on Trade and DevelopmentЗагружен: KnoemaДата обращения к источнику: 27 августа, 2018ВыбратьThis table shows exports, imports and sum/average of exports and imports as percentage of nominal gross domestic product (GDP). The indicators are calculated for trade in goods, trade in services and total trade in goods and services.
-
Февраль 2017Источник: National Institute of Statistics and Censuses, Costa RicaЗагружен: KnoemaДата обращения к источнику: 30 мая, 2017ВыбратьNational Accounts of Costa Rica
-
Май 2019Источник: International Monetary FundЗагружен: KnoemaДата обращения к источнику: 25 мая, 2019ВыбратьThis dataset provides a comprehensive view of government expense, including detailed classifications of compensation of employees, use of goods and services, consumption of fixed capital, interest payable, subsidies payable, grants payable, social benefits, and other expense.
-
Май 2019Источник: International Monetary FundЗагружен: KnoemaДата обращения к источнику: 28 мая, 2019ВыбратьThis dataset provides a comprehensive view of government revenue, including detailed classifications of taxes, social contributions, grants receivable, and other revenue.
-
Апрель 2019Источник: International Monetary FundЗагружен: KnoemaДата обращения к источнику: 04 мая, 2019ВыбратьThis dataset provides an overview of government’s cash flows, as summarized in the Statement of Sources and Uses of Cash, for those countries compiling GFS on a noncash basis (for example, an accrual basis) and are also including a cash flow statement.
-
Май 2019Источник: International Monetary FundЗагружен: KnoemaДата обращения к источнику: 25 мая, 2019ВыбратьThis dataset provides a comprehensive view of the functions, or socioeconomic objectives, that government aims to achieve through various kinds of expenditure, comprising detailed classifications of general public service, defense, public order and safety, economic affairs, environment protection, housing and community services, health, recreation, culture and religion, education, and social protection services.
-
Май 2019Источник: International Monetary FundЗагружен: KnoemaДата обращения к источнику: 23 мая, 2019ВыбратьThis dataset provides an overview of total financial assets and liabilities classified by the sector to which the counterpart claim belongs. The counterpart sectors include non-financial corporations, the central bank, deposit taking corporations, other financial corporation sectors, government sectors, international organizations, external financial corporations, external general government, and other external sectors.
-
Government Finance Statistics (GFS): Integrated Balance Sheet (Stock Positions and Flows in Assets and Liabilities)Май 2019Источник: International Monetary FundЗагружен: KnoemaДата обращения к источнику: 27 мая, 2019ВыбратьThis dataset provides a comprehensive view of the integrated balance sheet. In other words, changes between the opening and closing stock positions in assets and liabilities are explained through transactions, holding gains/losses, and other changes in the volume of assets and liabilities. Data on net investment in non-financial assets – a component of total expenditure – on its components and related stock positions are provided.
-
Май 2019Источник: International Monetary FundЗагружен: KnoemaДата обращения к источнику: 23 мая, 2019ВыбратьThis dataset provides an overview of government operations and stock positions, as well as several derived balances. The Statement of Government Operations shows revenue and expense, with their main components, the operating balance and net lending/net borrowing, as well as financing. The Balance sheet shows stock positions in assets and liabilities, with their main components, as well as net worth and net financial worth. In addition, data on gross debt and net debt are included.
-
Январь 2013Источник: World BankЗагружен: Pallavi SДата обращения к источнику: 20 марта, 2015ВыбратьData cited at: The World Bank https://datacatalog.worldbank.org/ Topic: GPE Results Forms Database Publication: https://datacatalog.worldbank.org/dataset/gpe-results-forms-database License: http://creativecommons.org/licenses/by/4.0/ The data originate from the education goals of developing-country partners of the Global Partnership for Education (GPE). Indicators compare actual values observed against targets, as set in education sector plans, joint sector reviews, and GPE grant applications. Indicators present key education outcomes and service delivery data; domestic, external, and GPE financing; learning outcomes; the composition of the Local Education Groups; and aid effectiveness in the education sector.
-
Март 2019Источник: Organisation for Economic Co-operation and DevelopmentЗагружен: KnoemaДата обращения к источнику: 27 марта, 2019ВыбратьThis dataset contains selected indicators for monitoring progress towards green growth to support policy making and inform the public at large. The indicator bring together the OECD's statistics, indicators and measures of progress. The dataset covers OECD countries as well as BRIICS economies (Brazil, Russian Federation, India, Indonesia, China and South Africa), and selected countries when possible. The indicators are selected according to well specified criteria and embedded in a conceptual framework, which is structured around four groups to capture the main features of green growth: Environmental and resource productivity, to indicate whether economic growth is becoming greener with more efficient use of natural capital and to capture aspects of production which are rarely quantified in economic models and accounting frameworks; The natural asset base, to indicate the risks to growth from a declining natural asset base; Environmental quality of life, to indicate how environmental conditions affect the quality of life and wellbeing of people; Economic opportunities and policy responses, to indicate the effectiveness ofpolicies in delivering green growth and describe the societal responses needed to secure business and employment opportunities.
-
Октябрь 2017Источник: World Resources InstituteЗагружен: KnoemaДата обращения к источнику: 04 сентября, 2018Выбрать
-
Февраль 2019Источник: United Nations Conference on Trade and DevelopmentЗагружен: KnoemaДата обращения к источнику: 02 апреля, 2019ВыбратьThis dataset provides information on gross domestic product (GDP), total and per capita at current and constant (2010) prices also it contains annual average growth rates of gross domestic product (GDP), total and per capita, in per cent. The total GDP is expressed in millions of dollars, while GDP per capita is expressed in dollars.
-
Май 2019Источник: EurostatЗагружен: KnoemaДата обращения к источнику: 23 мая, 2019ВыбратьNational accounts are a coherent set of macroeconomic indicators, which provide an overall picture of the economic situation and are widely used for economic analysis and forecasting, policy design and policy making. The data presented in this collection are the results of a pilot exercise on the sharing selected main GDP aggregates, population and employment data collected by different international organisations. It wasconducted by the Task Force in International Data Collection (TFIDC) which was established by the Inter-Agency Group on Economic and Financial Statistics (IAG). The goal of this pilot is to develop a set of commonly shared principles and working arrangements for data cooperation that could be implemented by the international agencies. The data sets are an experimental exercise to present national accounts data form various countries across the globe in one coherent folder, but users should be aware that these data are collected and validated by different organisations and not fully harmonised from a methodological point of view. The domain consists of the following collections:
-
Апрель 2018Источник: Global Trade AlertЗагружен: KnoemaДата обращения к источнику: 16 мая, 2019ВыбратьGlobal Trade Alert - Trade Coverage Estimates
- H
-
Апрель 2019Источник: World BankЗагружен: KnoemaДата обращения к источнику: 01 мая, 2019ВыбратьHealth Nutrition and Population Statistics database provides key health, nutrition and population statistics gathered from a variety of international and national sources. Themes include global surgery, health financing, HIV/AIDS, immunization, infectious diseases, medical resources and usage, noncommunicable diseases, nutrition, population dynamics, reproductive health, universal health coverage, and water and sanitation.
-
Март 2019Источник: World BankЗагружен: KnoemaДата обращения к источнику: 20 марта, 2019ВыбратьThis dataset presents HNP data by wealth quintile since 1990s to present. It covers more than 70 indicators, including childhood diseases and interventions, nutrition, sexual and reproductive health, mortality, and other determinants of health, for more than 90 low- and middle-income countries. The data sources are Demographic and Health Surveys (DHS) and Multiple Indicator Cluster Surveys (MICS).
-
Июнь 2018Источник: Organisation for Economic Co-operation and DevelopmentЗагружен: KnoemaДата обращения к источнику: 23 июля, 2018Выбрать
-
Декабрь 2018Источник: Institute for Health Metrics and EvaluationЗагружен: KnoemaДата обращения к источнику: 26 декабря, 2018ВыбратьGlobal Burden of Disease Study 2016 (GBD 2016) Healthcare Access and Quality Index Based on Amenable Mortality 1990–2016. Global Burden of Disease Study 2016 (GBD 2016) estimates were used in an analysis of personal healthcare access and quality for 195 countries and territories, as well as selected subnational locations, over time. This dataset includes the following global, regional, national, and selected subnational estimates for 1990-2016: age-standardized risk-standardized death rates from 24 non-cancer causes considered amenable to healthcare; age-standardized mortality-to-incidence ratios for 8 cancers considered amenable to healthcare; and the Healthcare Access and Quality (HAQ) Index and individual scores for each of the 32 causes on a scale of 0 to 100. Code used to produce the estimates is also included. Results were published in The Lancet in May 2018 in "Measuring performance on the Healthcare Access and Quality Index for 195 countries and territories and selected subnational locations: a systematic analysis from the Global Burden of Disease Study 2016
-
Ноябрь 2016Источник: International Monetary FundЗагружен: KnoemaДата обращения к источнику: 26 мая, 2017ВыбратьThe Historical Public Debt Database contains unbalanced panel data on Gross Domestic Product, Gross Government Debt, and Gross Government Debt-to-GDP Ratio for 187 countries. The series spans the years 1800 through 2015 although each country’s data depends on its date of independence and data availability. The database was constructed by bringing together a number of other datasets and information from original sources. For the most recent years, the data are linked to the IMF World Economic Outlook (WEO) database to facilitate regular updates.
-
Март 2010Источник: Maddison ProjectЗагружен: KnoemaВыбратьHistorical Statistics on Population, GDP and Per Capita GDP for 1-2008 AD period. Copyright Angus Maddison.
-
Апрель 2015Источник: KnoemaЗагружен: Pallavi SДата обращения к источнику: 02 апреля, 2015ВыбратьDescriptionThis is a crowd sourced effort to collect information about hospitals such as number of doctors, number of beds and list of healthcare services offerred by the hospitals. List of Indicators: 1. Hospital Name 2. GIS data 3. Location name (e.g.: Zorzor city, Lofa country) 4. Hospital ownership model (public/ private-for-profit/ NGO) 5. Referral level (primary, secondary, tertiary, quaternary) 6. # of staff total (Full time employees) 7. # of nurses (Full time employees) 8. # of doctors (Full time employees) 9. Current number of beds 10. Max number of beds 11. Current Occupancy Rate 12. # of operating rooms 13. Running water (Yes/No/Sometimes) 14. Electricity (Yes/No/Sometimes) 15. List of main healthcare services offered
-
Февраль 2016Источник: Statistics MauritiusЗагружен: KnoemaДата обращения к источнику: 07 декабря, 2018ВыбратьData cited at: https://mauritius.opendataforafrica.org/HDIM2016
-
Август 2018Источник: United Nations Development ProgrammeЗагружен: KnoemaДата обращения к источнику: 20 декабря, 2018ВыбратьThe Human Development Index (HDI) is a summary measure of achievements in three key dimensions of human development: a long and healthy life, access to knowledge and a decent standard of living. The HDI is the geometric mean of normalized indices for each of the the three dimensions.
-
Январь 2019Источник: Financial Tracking ServiceЗагружен: KnoemaДата обращения к источнику: 22 марта, 2019ВыбратьData cited at: Financial Tracking Service
- I
-
Июль 2018Источник: International Centre for Tax and DevelopmentЗагружен: KnoemaДата обращения к источнику: 23 мая, 2019ВыбратьICTD Government Revenue Dataset, 2018 A major obstacle to cross-country research on the role of revenue and taxation in development has been the weakness of available data. Government Revenue Dataset (GRD), developed through the International Centre for Tax and Development (ICTD), is aimed at overcoming this obstacle. It meticulously combines data from several major international databases, as well as drawing on data compiled from all available International Monetary Fund (IMF) Article IV reports. It achieves marked improvements in data coverage and accuracy, including a standardized approach to revenue from natural resources, and holds the promise of significant improvement in the credibility and robustness of research in this area. Dataset contains Central, General and merged government revenue data reported as % of GDP.
-
Июнь 2018Источник: International Development AssociationЗагружен: Pallavi SДата обращения к источнику: 24 мая, 2019ВыбратьThe World Bank’s IDA Resource Allocation Index (IRAI) is based on the results of the annual CPIA exercise that covers the IDA eligible countries.The CPIA rates countries against a set of 16 criteria grouped in four clusters: (a) economic management; (b) structural policies; (c) policies for social inclusion and equity; and (d) public sector management and institutions. The criteria (pdf) are focused on balancing the capture of the key factors that foster growth and poverty reduction, with the need to avoid undue burden on the assessment process. To fully underscore the importance of the CPIA in the IDA Performance Based Allocations, the overall country score is referred to as the IRAI.
-
Март 2019Источник: World BankЗагружен: KnoemaДата обращения к источнику: 20 марта, 2019ВыбратьData cited at: The World Bank https://datacatalog.worldbank.org/ Topic: IDA Results Measurement System Publication: https://datacatalog.worldbank.org/dataset/ida-results-measurement-system License: http://creativecommons.org/licenses/by/4.0/ The IDA Results Measurement System dataset measures progress on aggregate outcomes for IDA countries for selected indicators. It includes key country outcome indicators covering areas that are consistent with the Millennium Development Goals, are priorities in many national development plans and/or poverty reduction strategies, and reflect IDA's activities in IDA countries. The indicators capture both the economic growth and the human development priorities of ongoing IDA programs.
-
Июнь 2018Источник: World BankЗагружен: KnoemaДата обращения к источнику: 28 июня, 2018ВыбратьMember countries are allocated votes at the time of membership and subsequently for additional subscriptions to capital. Votes are allocated differently in each organization. Each member receives the votes it is allocated under IDA replenishments according to the rules established in each IDA replenishment resolution. Votes consist of subscription votes and membership votes.
-
Декабрь 2018Источник: Islamic Development BankЗагружен: KnoemaДата обращения к источнику: 08 марта, 2019Выбрать
-
Февраль 2011Источник: Institute for Health Metrics and EvaluationЗагружен: KnoemaВыбратьIHME results from paper, Worldwide mortality in men and women aged 15–59 years from 1970 to 2010: a systematic analysis, published online in The Lancet on April 30 2010. This dataset provides global estimates of adult mortality risk, 45q15 (probability of death between the ages of 15 years and 60 years), between 1970 and 2010.
-
Февраль 2011Источник: Institute for Health Metrics and EvaluationЗагружен: KnoemaВыбратьIHME results from paper, Neonatal, post neonatal, childhood, and under-5 mortality for 187 countries, 1970-2010: a systematic analysis of progress towards Millennium Development Goal 4, published online in The Lancet on May 24 2010. This dataset provides estimates of neonatal, post neonatal, childhood, and under-5 mortality for 187 countries between 1970 and 2010.
-
Декабрь 2010Источник: Institute for Health Metrics and EvaluationЗагружен: KnoemaДата обращения к источнику: 31 июля, 2013ВыбратьIHME research, published online in The Lancet in April 2010, with data from a global assessment of levels and trends in maternal mortality for the years 1980-2008. The study, Maternal mortality for 181 countries, 1980-2008: a systematic analysis of progress towards Millennium Development Goal 5, provides global, regional, and national level estimates of the maternal mortality ratio (MMR - the number of maternal deaths per 100,000 live births) as well as the number of maternal deaths.
-
Сентябрь 2011Источник: Institute for Health Metrics and EvaluationЗагружен: KnoemaВыбратьIHME results data from global analysis of maternal mortality for years 1990-2011 published online in The Lancet in September 2011. The study, Progress towards Millennium Development Goals 4 and 5 on maternal and child mortality: an updated systematic analysis, provides global and country level estimates of the maternal mortality ratio (MMR - the number of maternal deaths per 100,000 live births) and the number of maternal deaths.
-
Декабрь 2010Источник: Institute for Health Metrics and EvaluationЗагружен: KnoemaВыбратьIHME results from paper, Public financing of health in developing countries: a cross-national systematic analysis published in The Lancet in April 2010. This dataset provides estimates on domestically financed government health expenditures in developing countries and development assistance for health (DAH) to governmental and non-governmental recipients from 1995 to 2006.
-
Июль 2017Источник: International Monetary FundЗагружен: KnoemaДата обращения к источнику: 10 октября, 2017ВыбратьCovering 187 countries including most low-income countries, the toolkit provides indicators on export product diversification and export product quality from 1962-2010. The measures in this toolkit are based on an updated version of the UN–NBER dataset, which harmonizes COMTRADE bilateral trade flow data at the 4-digit SITC (Rev. 1) level. The export diversification and quality database was developed by IMF staff under an IMF-DFID research collaboration. The Export Diversification Database has three main indicators: the Export Diversification Index, the Extensive Margin, and the Intensive Margin. Higher values for the all three indices indicate lower diversification. The Export Quality Database contains export quality measures across different aggregation levels of export products. Higher values for the quality indices indicate higher quality levels.
-
Июль 2018Источник: International Monetary FundЗагружен: KnoemaДата обращения к источнику: 16 июля, 2018ВыбратьThe FAS is the key source of global supply-side data on financial inclusion, encompassing data on access to and usage of financial services by firms and households that can be compared across countries and over time. Contains 180 time series and 65 indicators that are expressed as ratios to GDP, land area, or adult population to facilitate cross-economy comparisons. Provision of FAS data is voluntary.
-
Апрель 2019Источник: International Monetary FundЗагружен: KnoemaДата обращения к источнику: 11 апреля, 2019ВыбратьThe World Economic Outlook (WEO) database contains selected macroeconomic data series from the statistical appendix of the World Economic Outlook report, which presents the IMF staff's analysis and projections of economic developments at the global level, in major country groups and in many individual countries. The WEO is released in April and September/October each year. Use this database to find data on national accounts, inflation, unemployment rates, balance of payments, fiscal indicators, trade for countries and country groups (aggregates), and commodity prices whose data are reported by the IMF. Data are available from 1980 to the present, and projections are given for the next two years. Additionally, medium-term projections are available for selected indicators. For some countries, data are incomplete or unavailable for certain years. Changes to the April 2019 Database: FYR Macedonia is now called North Macedonia. In February 2019, Zimbabwe adopted a new local currency unit, the RTGS dollar, which has become the official unit of account. Efforts are underway to revise and update all national accounts series to the new RTGS dollar. Current data are based on IMF staff estimates of price and exchange rate developments in US (and RTGS) dollars. Staff estimates of US dollar values may differ from authorities’ estimates.
-
Декабрь 2018Источник: Organisation for Economic Co-operation and DevelopmentЗагружен: Pallavi SДата обращения к источнику: 03 декабря, 2018ВыбратьThis database contains information on several demographic and labour market characteristics of the population of 28 OECD countries around the year 2000, by country of birth. The OECD countries included are Australia, Austria, Belgium, Canada, the Czech Republic, Denmark, Finland, France, Germany, Greece, Hungary, Ireland, Italy, Japan, Luxembourg, Mexico, Netherlands, New Zealand, Norway, Poland, Portugal, the Slovak Republic, Spain, Sweden, Switzerland, Turkey, the United Kingdom and the United States. Most of the thematic files of the database include three core variables: the country of residence, the country of birth and educational attainment. Other variables available in the database include age, gender, citizenship, duration of stay, labour force status, occupation, sector of activity and field of study. In general, the database covers all individuals aged 15 and older.
-
Март 2016Источник: Organisation for Economic Co-operation and DevelopmentЗагружен: KnoemaДата обращения к источнику: 08 ноября, 2017ВыбратьThe sources for this database are mainly census data, from the 2000 round of censuses. Census data were used for 22 countries. Countries not taking periodic censuses but keeping population registers have provided data extracted from these registers; this is the case for four countries: Denmark, Finland, Norway and Sweden. For some countries, not all themes covered in the database are present in the national census or register. Labour force surveys, provided by Eurostat and averaged over the period 1998-2002, have been used to fill the gaps where possible.
-
Декабрь 2018Источник: Organisation for Economic Co-operation and DevelopmentЗагружен: Pallavi SДата обращения к источнику: 03 декабря, 2018ВыбратьThis database contains information on several demographic and labour market characteristics of the population of 28 OECD countries around the year 2000, by country of birth. The OECD countries included are Australia, Austria, Belgium, Canada, the Czech Republic, Denmark, Finland, France, Germany, Greece, Hungary, Ireland, Italy, Japan, Luxembourg, Mexico, Netherlands, New Zealand, Norway, Poland, Portugal, the Slovak Republic, Spain, Sweden, Switzerland, Turkey, the United Kingdom and the United States. Most of the thematic files of the database include three core variables: the country of residence, the country of birth and educational attainment. Other variables available in the database include age, gender, citizenship, duration of stay, labour force status, occupation, sector of activity and field of study. In general, the database covers all individuals aged 15 and older.
-
Декабрь 2018Источник: Organisation for Economic Co-operation and DevelopmentЗагружен: Pallavi SДата обращения к источнику: 03 декабря, 2018ВыбратьThis database contains information on several demographic and labour market characteristics of the population of 28 OECD countries around the year 2000, by country of birth. The OECD countries included are Australia, Austria, Belgium, Canada, the Czech Republic, Denmark, Finland, France, Germany, Greece, Hungary, Ireland, Italy, Japan, Luxembourg, Mexico, Netherlands, New Zealand, Norway, Poland, Portugal, the Slovak Republic, Spain, Sweden, Switzerland, Turkey, the United Kingdom and the United States. Most of the thematic files of the database include three core variables: the country of residence, the country of birth and educational attainment. Other variables available in the database include age, gender, citizenship, duration of stay, labour force status, occupation, sector of activity and field of study. In general, the database covers all individuals aged 15 and older with a tertiary education.
-
Декабрь 2018Источник: Organisation for Economic Co-operation and DevelopmentЗагружен: Pallavi SДата обращения к источнику: 03 декабря, 2018ВыбратьThis database contains information on several demographic and labour market characteristics of the population of 28 OECD countries around the year 2000, by country of birth. The OECD countries included are Australia, Austria, Belgium, Canada, the Czech Republic, Denmark, Finland, France, Germany, Greece, Hungary, Ireland, Italy, Japan, Luxembourg, Mexico, Netherlands, New Zealand, Norway, Poland, Portugal, the Slovak Republic, Spain, Sweden, Switzerland, Turkey, the United Kingdom and the United States. Most of the thematic files of the database include three core variables: the country of residence, the country of birth and educational attainment. Other variables available in the database include age, gender, citizenship, duration of stay, labour force status, occupation, sector of activity and field of study. In general, the database covers all individuals aged 15 and older.
-
Март 2016Источник: Organisation for Economic Co-operation and DevelopmentЗагружен: KnoemaДата обращения к источнику: 08 ноября, 2017ВыбратьThe sources for this database are mainly census data, from the 2000 round of censuses. Census data were used for 22 countries. Countries not taking periodic censuses but keeping population registers have provided data extracted from these registers; this is the case for four countries: Denmark, Finland, Norway and Sweden. For some countries, not all themes covered in the database are present in the national census or register. Labour force surveys, provided by Eurostat and averaged over the period 1998-2002, have been used to fill the gaps where possible.
-
Декабрь 2018Источник: Organisation for Economic Co-operation and DevelopmentЗагружен: KnoemaДата обращения к источнику: 03 декабря, 2018ВыбратьThe sources for this database are mainly census data, from the 2000 round of censuses. Census data were used for 22 countries. Countries not taking periodic censuses but keeping population registers have provided data extracted from these registers; this is the case for four countries: Denmark, Finland, Norway and Sweden. For some countries, not all themes covered in the database are present in the national census or register. Labour force surveys, provided by Eurostat and averaged over the period 1998-2002, have been used to fill the gaps where possible. The exact national source and reference period for each file is given in Table A.1 (see the methodological document).
-
Декабрь 2018Источник: Organisation for Economic Co-operation and DevelopmentЗагружен: Pallavi SДата обращения к источнику: 03 декабря, 2018ВыбратьThis database contains information on several demographic and labour market characteristics of the population of 28 OECD countries around the year 2000, by country of birth. The OECD countries included are Australia, Austria, Belgium, Canada, the Czech Republic, Denmark, Finland, France, Germany, Greece, Hungary, Ireland, Italy, Japan, Luxembourg, Mexico, Netherlands, New Zealand, Norway, Poland, Portugal, the Slovak Republic, Spain, Sweden, Switzerland, Turkey, the United Kingdom and the United States. Most of the thematic files of the database include three core variables: the country of residence, the country of birth and educational attainment. Other variables available in the database include age, gender, citizenship, duration of stay, labour force status, occupation, sector of activity and field of study. In general, the database covers all individuals aged 15 and older.
-
Сентябрь 2015Источник: Malaria Atlas Project, University of OxfordЗагружен: KnoemaДата обращения к источнику: 16 июня, 2016ВыбратьThis Dataset shows the modelled parasite rate for Plasmodium falciparum for the years 2000-2015 for all African countries where it is endemic. The Dataset shows the percentage of 2-10 year olds infected by the parasite for each year.
-
Ноябрь 2018Источник: United Nations Conference on Trade and DevelopmentЗагружен: KnoemaДата обращения к источнику: 16 ноября, 2018Выбрать
-
Июль 2014Источник: Organisation for Economic Co-operation and DevelopmentЗагружен: Pallavi SДата обращения к источнику: 04 августа, 2014ВыбратьThe allocation of bilateral intermediate imports across using industries assumes that import coefficients are the same for all trade partners, i.e. SHAREipkt is identical across exporter countries. Hence, the bilateral pattern of imported intermediates from industry p is the same across all using industries k. However, it is different from the bilateral pattern of total imports from industry p because trade data (measured by VALUEijpt) allows distinguishing bilateral imports of intermediates from final good imports in industry p. While the BEC classification enables the identification of intermediate goods, no similar classification is available for trade in services, due to the high level of aggregation in services trade data. While goods trade data are based on customs declarations allowing the identification of goods at a highly disaggregated level, services trade data are based on a variety of information such as business accounts, administrative sources, surveys, and estimation techniques (Manual on Statistics of International Trade in Services, 2002). Hence, in the case of trade in services, VALUEijpt is the total value of imports of service p, i.e. both final and intermediate (and not only services that are used in the production of other goods and services, as in the case of goods data). By making an additional assumption and adjusting SHAREipkt, it is however possible to calculate trade in intermediate services. In the case of services imports, SHAREipkt is the share of imported service inputs p used by industry k in total imports of p of country i. In the case of services, besides the assumption that all trading partners have the same distribution of intermediate imports p across using industries k, it is furthermore required that the share of intermediate services in overall bilateral services imports of country i is the same across all partner countries j. Finally, it should be mentioned that trade data reported in the trade statistics do not fully match imports as reported in I-O tables. One main reason is that while trade data is recorded at consumer prices, I-O tables are evaluated at producer prices. There are also other differences such as the treatment of re-exports, scrap metal, waste products and second hand goods or unallocated trade data.
-
Сентябрь 2017Источник: National Institute of Statistics, Republic of GuineaЗагружен: KnoemaДата обращения к источнику: 14 декабря, 2018ВыбратьData cited at: https://guinea.opendataforafrica.org/kruwzwd Imports of products by zone and country of origin, 2011 - 2012
-
Январь 2018Источник: International Labour OrganizationЗагружен: KnoemaДата обращения к источнику: 31 августа, 2018ВыбратьThe series is part of the ILO estimates and is harmonized to account for differences in national data and scope of coverage, collection and tabulation methodologies as well as for other country-specific factors. Data for 1990-2015 are estimates while 2016-2030 data are projections. The dataset was updated as of July 2015. For more information, refer to the ILO estimates and projections methodological note.
-
Май 2019Источник: International Labour OrganizationЗагружен: KnoemaДата обращения к источнику: 21 мая, 2019ВыбратьThis indicator conveys the number of persons of working age outside the labour force (that is, not employed or unemployed) expressed as a percentage of the working-age population. The working-age population is commonly defined as persons aged 15 years and older, but this varies from country to country. In addition to using a minimum age threshold, certain countries also apply a maximum age limit.
-
Март 2019Источник: Global Trade AlertЗагружен: KnoemaДата обращения к источнику: 03 апреля, 2019ВыбратьThe Global Trade Alert (GTA) was launched in June 2009 when it was feared that the global financial crisis would lead governments to adopt widespread 1930s-style beggar-thy-neighbour policies. Although global in scope, the GTA has given particular attention to the policy choices of the G-20 governments ever since their leaders made a “no protectionism” pledge in Washington DC in November 2008. Although initially conceived as a trade policy monitoring initiative, as thousands of policy announcements have been documented, the GTA has become a widely-used input for analysis and decision-making by firms, industry associations, journalists, researchers, international organisations, and governments. This reflects the fact that, as the International Monetary Fund noted in 2016, the GTA “has the most comprehensive coverage of all types of trade-discriminatory and trade liberalizing measures.”
-
Февраль 2019Источник: Heritage FoundationЗагружен: KnoemaДата обращения к источнику: 04 февраля, 2019ВыбратьData cited at: Heritage Foundation Economic freedom is the fundamental right of every human to control his or her own labor and property. In an economically free society, individuals are free to work, produce, consume, and invest in any way they please, with that freedom both protected by the state and unconstrained by the state. In economically free societies, governments allow labor, capital and goods to move freely, and refrain from coercion or constraint of liberty beyond the extent necessary to protect and maintain liberty itself. Economic Freedom Scores: Range and level of freedom 80–100:- Free 70–79.9:- Mostly Free 60–69.9:- Moderately Free 50–59.9:- Mostly Unfree 0–49.9:- Repressed
-
Май 2018Источник: Coffee Board of IndiaЗагружен: KnoemaДата обращения к источнику: 10 августа, 2018Выбрать
-
Июль 2018Источник: Ministry of Finance, IndiaЗагружен: KnoemaДата обращения к источнику: 05 сентября, 2018ВыбратьThe dataset provides the data on the direction of imports and exports by regions and Countries in Crore rupees and Million U.S, dollars India's Economic Survey: Direction of Trade, 2017-18
-
Апрель 2019Источник: United Nations Industrial Development OrganizationЗагружен: KnoemaДата обращения к источнику: 06 мая, 2019ВыбратьIndustrial Statistics Database, INDSTAT 2 2019, ISIC Revision 3 (Demo)
-
Февраль 2019Источник: International Labour OrganizationЗагружен: KnoemaДата обращения к источнику: 15 февраля, 2019ВыбратьThe series is part of the ILO estimates and is harmonized to account for differences in national data and scope of coverage, collection and tabulation methodologies as well as for other country-specific factors. For more information, refer to the ILO estimates and projections methodological note.
-
Февраль 2019Источник: National Institute of Statistics, ItalyЗагружен: KnoemaДата обращения к источнику: 01 марта, 2019ВыбратьData source(s) used: Vital statistics on causes of death: The Vital statistics system on causes of death is the main source for the evaluation of the health status of the population, and for the health programs and resources allocation. Data on causes of all deaths occurring in Italy during a calendar year are collected by the death certificates Istat/D.4 and D.4 bis. The physician must fill the health section of the certificate (part A) and the civil status officer of the appurtenant municipality must fill the demographic section of the certificate (part B).
-
Май 2019Источник: International Labour OrganizationЗагружен: KnoemaДата обращения к источнику: 28 мая, 2019ВыбратьInflow of migrants refer to the number of immigrants who changed their country of usual residence during the reference period. A person's country of usual residence is the country in which the person has a place to live where he or she normally spends the daily period of rest. Temporary travel abroad for purposes of recreation, holiday, business, medical treatment or religious pilgrimage does not entail a change in the country of usual residence. Data are disaggregated by sex and country of origin. A person's country of origin is that from which the person originates, i.e. the country of his or her citizenship (or, in the case of stateless persons, the country of usual residence).
-
Январь 2018Источник: Food and Agriculture OrganizationЗагружен: KnoemaДата обращения к источнику: 22 марта, 2019ВыбратьThe Fertilizer archive dataset contains information on the Production, Trade and Consumption of chemical and mineral fertilizers products, both in total nutrients and in amount of product, over the time series 1961 to 2002. The dataset also contains data on Prices paid by farmers expressed in local currencies (as a consequence no country aggregates are available) for single fertilizer products. This dataset is an archive and it is disseminated as it was in the previous FAOSTAT System. No dataset updates made or to be made in the future.
-
Октябрь 2018Источник: U.S. Department of AgricultureЗагружен: KnoemaДата обращения к источнику: 16 октября, 2018ВыбратьImproving agricultural productivity has been the world's primary means of assuring that the needs of a growing population don't outstrip the ability of humanity to supply food. Over the past 50 years, productivity growth in agriculture has allowed food to become more abundant and cheaper (see Growth in Global Agricultural Productivity: An Update, Amber Waves, November 2013, and New Evidence Points to Robust But Uneven Productivity Growth in Global Agriculture, Amber Waves, September 2012). A broad concept of agricultural productivity is total factor productivity (TFP). TFP takes into account all of the land, labor, capital, and material resources employed in farm production and compares them with the total amount of crop and livestock output. If total output is growing faster than total inputs, we call this an improvement in total factor productivity ("factor" = input). TFP differs from measures like crop yield per acre or agricultural value-added per worker because it takes into account a broader set of inputs used in production. TFP encompasses the average productivity of all of these inputs employed in the production of all crop and livestock commodities. "Growth accounting" provides a practicable way of measuring changes in agricultural TFP across a broad set of countries and regions, and for the world as a whole, given limited international data on production outputs, inputs, and their economic values. The approach (described in detail in Documentation and Methods) gives agricultural TFP growth rates, but not TFP levels, across the countries and regions of the world in a consistent, comparable way. Most of the data for the analysis comes from FAOSTAT. In some cases Food and Agriculture Organization (FAO) input and output data are supplemented with data from national statistical sources. Note: To facilitate international comparisons, certain simplifying assumptions must be made, and as such the estimates of TFP growth reported here may not be exactly the same as TFP growth estimates reported in other studies using different assumptions or methods. In particular, our TFP estimates for the United States differ slightly from those reported in ERS' Agricultural Productivity in the U.S. data product.
-
Декабрь 2015Источник: World BankЗагружен: KnoemaДата обращения к источнику: 05 марта, 2016ВыбратьPurchasing Power Parities and the Real Size of World Economies. A Comprehensive Report of the 2011 International Comparison Program
-
Июнь 2018Источник: Barro-LeeЗагружен: KnoemaДата обращения к источнику: 12 декабря, 2018ВыбратьData cited at: Barro-Lee The Barro-Lee Data set (2010) extends their previous estimates from 1950 to 2010, and provide more, improved data disaggregated by sex and and by 5-year age intervals. It provides educational attainment data for 146 countries in 5-year intervals from 1950 to 2010 as well as information about the distribution of educational attainment of the adult population over age 15 and over age 25 by sex at seven levels of schooling. Average years of schooling at all levels are also measured for each country and for regions in the world. Note: Cited at Barro, Robert and Jong-Wha Lee, April 2010, "A New Data Set of Educational Attainment in the World, 1950-2010." NBER Working Paper No. 15902
-
Март 2019Источник: World BankЗагружен: KnoemaДата обращения к источнику: 20 марта, 2019ВыбратьData cited at: The World Bank https://datacatalog.worldbank.org/ Topic: International Debt Statistics Publication: https://datacatalog.worldbank.org/dataset/international-debt-statistics License: http://creativecommons.org/licenses/by/4.0/ Focuses on financial flows, trends in external debt, and other major financial indicators for low- and middle-income countries. Includes over 200 time series indicators from 1970 to 2016, for most reporting countries, and pipeline data for scheduled debt service payments on existing commitments to 2024. Note: Total reserves in months of imports=(Total reserves/Total Imports)*12
-
Май 2019Источник: U.S. Energy Information AdministrationЗагружен: KnoemaДата обращения к источнику: 23 мая, 2019Выбрать
-
Август 2014Источник: U.S. Department of AgricultureЗагружен: KnoemaДата обращения к источнику: 02 сентября, 2015ВыбратьThis data set contains estimates of total and marginal budget shares and income and price elasticities for nine broad consumption groups and eight food subgroups across 144 countries. Total and marginal budget shares and income and price elasticities are estimated using 2005 International Comparison Program (ICP) data, which is maintained by the ICP Development Data Group of the World Bank
-
Июль 2017Источник: U.S. Department of AgricultureЗагружен: KnoemaДата обращения к источнику: 06 марта, 2018ВыбратьThis dataset is the basis for the International Food Security Assessment, 2017-27 released in July 2017. This annual ERS report projects food availability and access for 76 low- and middle-income countries over a 10-year period. The dataset includes annual country-level data on area, yield, production, nonfood use, trade, and consumption for grains and root and tuber crops (combined as R&T in the documentation tables), food aid, total value of imports and exports, gross domestic product, and population compiled from a variety of sources.
-
Апрель 2019Источник: Organisation for Economic Co-operation and DevelopmentЗагружен: KnoemaДата обращения к источнику: 12 апреля, 2019ВыбратьThis dataset contains the number of people who graduated from an education programme by country of origin and sex.
-
Декабрь 2018Источник: U.S. Department of AgricultureЗагружен: KnoemaДата обращения к источнику: 26 декабря, 2018ВыбратьThe International Macroeconomic Data Set provides historical and projected data for 189 countries that account for more than 99 percent of the world economy. These macroeconomic data and projections are assembled explicitly to serve as underlying assumptions for the annually updated USDA agricultural supply and demand projections, which provide a 10-year outlook on U.S. and global agriculture. The macroeconomic projections describe the long-term scenario that is used as a benchmark for analyzing the impacts of alternative scenarios and macroeconomic shocks. The projections assume there are no changes in policy and abstract from business cycle effects. Historical data are available for real (inflation-adjusted) gross domestic product (GDP), inflation, population, and real exchange rates from 1969 to the most recent available year, and each variable is projected forward to 2030.
-
International migrant stock at mid-year by sex and by major area, region, country or area, 1990-2017Декабрь 2017Источник: United Nations Development ProgrammeЗагружен: KnoemaДата обращения к источнику: 06 февраля, 2018ВыбратьThe estimates are based on official statistics on the foreign-born or the foreign population, classified by sex, and age. Most of the statistics utilised to estimate the international migrant stock were obtained from population censuses. Additionally, population registers and nationally representative surveys provided information on the number and composition of international migrants.
-
Январь 2018Источник: United Nations Development ProgrammeЗагружен: KnoemaДата обращения к источнику: 16 марта, 2018Выбрать
-
Декабрь 2018Источник: Organisation for Economic Co-operation and DevelopmentЗагружен: KnoemaДата обращения к источнику: 11 декабря, 2018ВыбратьMost of the data published in this database are taken from the individual contributions of national correspondents appointed by the OECD Secretariat with the approval of the authorities of Member countries. Consequently, these data have not necessarily been harmonised at international level. This network of correspondents, constituting the Continuous Reporting System on Migration (SOPEMI), covers most OECD Member countries as well as the Baltic States, Bulgaria and Romania. SOPEMI has no authority to impose changes in data collection procedures. It is an observatory which, by its very nature, has to use existing statistics. However, it does play an active role in suggesting what it considers to be essential improvements in data collection and makes every effort to present consistent and well-documented statistics.
-
Январь 2006Источник: American UniversityЗагружен: KnoemaДата обращения к источнику: 12 июля, 2016ВыбратьInternational patent protection: 1960–2005 Walter G. Park ∗ Department of Economics, American University, 4400 Massachusetts Avenue NW, Washington, DC 20016, USA Received 24 October 2007; received in revised form 14 December 2007; accepted 29 January 2008 Available online 10 March 2008 http://fs2.american.edu/wgp/www/res_policy08.pdf
-
Июнь 2013Источник: United Nations Conference on Trade and DevelopmentЗагружен: KnoemaДата обращения к источнику: 22 июля, 2013ВыбратьTime series on international reserves (including gold), by individual country, expressed in millions of dollars. It further presents the number of months of merchandise imports that these reserves could finance at current imports level, as well as annual changes in total reserves.
-
Апрель 2019Источник: Organisation for Economic Co-operation and DevelopmentЗагружен: KnoemaДата обращения к источнику: 16 апреля, 2019ВыбратьThis indicator reports the percentage of students of each country of origin over the total of international students.
-
Декабрь 2016Источник: Federal Communications CommissionЗагружен: KnoemaДата обращения к источнику: 14 апреля, 2017Выбрать
-
Июнь 2017Источник: World BankЗагружен: KnoemaДата обращения к источнику: 30 октября, 2018ВыбратьData cited at: The World Bank https://datacatalog.worldbank.org/ Topic: ESCAP-World Bank: International Trade Costs Publication: https://datacatalog.worldbank.org/dataset/escap-world-bank-international-trade-costs License: http://creativecommons.org/licenses/by/4.0/ The Trade Costs Dataset provides estimates of bilateral trade costs in agriculture and manufactured goods for the 1995-2015 period. It is built on trade and production data collected in 178 countries. Symmetric bilateral trade costs are computed using the Inverse Gravity Framework (Nov. 2009), which estimates trade costs for each country pair using bilateral trade and gross national output. Trade costs are available for two sectors: trade in manufactured goods, and agriculture. Energy is excluded.
-
Июнь 2013Источник: World Integrated Trade SolutionЗагружен: KnoemaДата обращения к источнику: 04 января, 2019ВыбратьThe dataset provides a consolidated and reconciled version of multiple sources of bilateral trade data. Its advantages over the original source data are that it provides broader coverage based on mirror flows, reconciliation of aggregate with underlying flows, and consolidation (allowing for broader coverage than offered by source data). One weakness, inherent in all available data of this type, is that even with mirror flows, a substantial share of South-South trade is unreported. As such, while we can recover North-South exports from mirror flows, we cannot recover all unreported bilateral flows. The scale of the problem can be gauged by comparing trade with the world with bilateral flows in the database. Notes: • values are in millions of current US dollars • Because of the apparent mixing of zero and missing by source agencies, we have opted to use missing, or “.”, for reported zero and missing flows. • total with world is the greater of reported total with world, or aggregate of bilateral flows • region XWD holds difference between all bilateral flows and global (trade with world) total. It is the sum of flows with missing partners. This means XWD holds identified flows without a partner. It does not hold flows that are totally unreported. • all unreported REP:PAR:BOP:YEAR combinations, meaning that do not even appear in the dataset, can be safely assumed to be missing. By this, we mean there is no reported source for these flows, and the countries-product-year combination does not even occur in any of the underlying source data.
-
Май 2019Источник: Statistics DenmarkЗагружен: KnoemaДата обращения к источнику: 13 мая, 2019ВыбратьInternational trade in services, quarterly by imports and exports, country and time
-
Октябрь 2018Источник: Statistics DenmarkЗагружен: KnoemaДата обращения к источнику: 06 марта, 2019Выбрать
-
International trade; Imports and exports of services by country, 2003-2013, Netherlands (discontinued)Октябрь 2016Источник: Statistics NetherlandsЗагружен: KnoemaДата обращения к источнику: 06 октября, 2018ВыбратьData cited at: CBS StatLine databank https://opendata.cbs.nl/statline/portal.html?_la=en&_catalog=CBS Publication: International trade; Imports and exports of services by country, 2003-2013 https://opendata.cbs.nl/portal.html?_la=en&_catalog=CBS&tableId=80414ENG&_theme=1118 License: http://creativecommons.org/licenses/by/4.0/ This table contains information on Dutch imports and exports of services broken down by various service types and countries (groups). From 2006 onwards more detailed information is available than the years before. In addition, the annual figures show more detailed information than the quarterly figures. Data available from 2003 to 2013. Status of the figures: The figures are definite. Changes as of 8 October 2014: None, this table has been discontinued. When will new figures be published? No longer applicable.
-
Октябрь 2015Источник: Water FootPrint NetworkЗагружен: KnoemaДата обращения к источнику: 27 октября, 2015ВыбратьData cited at: The Water Footprint Network https://waterfootprint.org/en/ Topic: International virtual water flow statistics Publication: https://waterfootprint.org/en/resources/waterstat/international-virtual-water-flow-statistics/ Reference: Hoekstra, A.Y. & Mekonnen, M.M. (2012) The water footprint of humanity, Proceedings of the National Academy of Sciences, 109(9): 3232–3237 License: https://creativecommons.org/licenses/by-sa/3.0/
-
Декабрь 2012Источник: Internet World StatsЗагружен: KnoemaДата обращения к источнику: 11 сентября, 2013ВыбратьInternet World Stats is an International website that features up to date world Internet Usage, Population Statistics, Travel Stats and Internet Market Research Data, for over 233 individual countries and world regions.
-
Февраль 2018Источник: World BankЗагружен: KnoemaДата обращения к источнику: 02 августа, 2018ВыбратьInternet users are individuals who have used the Internet (from any location) in the last 3 months. The Internet can be used via a computer, mobile phone, personal digital assistant, games machine, digital TV etc.
-
Сентябрь 2018Источник: Food and Agriculture OrganizationЗагружен: KnoemaДата обращения к источнику: 22 марта, 2019ВыбратьThe FAO Statistics Division has compiled an updated dataset series of capital stock in Agriculture from 1975-2007 using 2005 constant prices as the base year. The dataset on capital stock in agriculture are important for analyzing a number of policy issues related to sustainable growth of agriculture and achieving food security.
-
Декабрь 2018Источник: Food and Agriculture OrganizationЗагружен: KnoemaДата обращения к источнику: 27 мая, 2019ВыбратьData are collected directly from countries using a FAO questionnaire, which was developed in partnership with the International Monetary Fund, as the IMF collects global data on government expenditures and is the international organization responsible for developing guidelines on the Classification of Functions of Government (COFOG). The FAO questionnaire obtains additional detail relevant to Agriculture and Rural Development not available from the IMF questionnaire. The FAO dataset consists of a time series, from 2000 onwards, of government expenditures in terms of expenditures in: (1) Total; (2) Economic affairs; (3) Agriculture, Forestry, Fishing and Hunting, along with its three disaggregated subsectors of Agriculture, Forestry and Fishing; and 4) Environmental Protection. In addition, expenditures in each detailed function are further disaggregated into recurrent and capital expenditures, the latter of which serves as a proxy for expenditures in investment goods. Additional indicators include the total share of government expenditures allocated to agriculture, and an agriculture orientation index (ratio of the total share of government expenditures to agriculture, over the total share of GDP from agricultural value-added). Though the goal is to have complete and consistent coverage for all countries, relatively low response rates for this new domain and country level differences in data collection and reporting creates some challenges in providing a complete and consistent global dataset.
-
Январь 2018Источник: Food and Agriculture OrganizationЗагружен: KnoemaДата обращения к источнику: 22 марта, 2019ВыбратьUN FAO Resource Statistics - Machinery. The Agricultural Resources domain covers: Investment, Land and irrigation, Labor, Machinery, Fertilizers, Pesticides, Population. The Resources domain considers factors of production for the agricultural sector. Broadly speaking, this section details how countries differ in endowments of the three classic inputs: labor, land and capital. Qualitative differences are important for each but are particularly difficult to summarize in a single indicator for land, the productivity of which depends heavily on water and soil conditions.
-
Январь 2018Источник: Food and Agriculture OrganizationЗагружен: KnoemaДата обращения к источнику: 22 марта, 2019Выбрать
-
Декабрь 2015Источник: International Monetary FundЗагружен: KnoemaДата обращения к источнику: 25 марта, 2016ВыбратьThis dataset provides comprehensive data for investment and capital stock for the general government, private sector and public-private partnerships, across the Fund member countries.
-
Июнь 2017Источник: Organisation for Economic Co-operation and DevelopmentЗагружен: Pallavi SДата обращения к источнику: 16 января, 2018ВыбратьThis table contains figures on affiliates under foreign control by investing country in the total manufacturing, total services and total business enterprise sectors.
-
Апрель 2019Источник: Organisation for Economic Co-operation and DevelopmentЗагружен: KnoemaДата обращения к источнику: 12 апреля, 2019Выбрать
-
Июль 2014Источник: Organisation for Economic Co-operation and DevelopmentЗагружен: Pallavi SДата обращения к источнику: 04 августа, 2014ВыбратьThe IPP.Stat is the statistics portal of the Innovation Policy Platform containing the main available indicators relevant to a country’s innovation performance. In addition to the traditional indicators used to monitor innovation, the range of the coverage to be found in the IPP.Stat calls for the inclusion of indicators from other domains that describe the broader national and international context in which innovation occurs. Indicators are sourced primarily from the OECD and the World Bank, as well as from other sources of comparable quality. The statistics portal is still under development.
- J
-
Апрель 2019Источник: World BankЗагружен: KnoemaДата обращения к источнику: 22 апреля, 2019ВыбратьThe Joint External Debt Hub (JEDH)-jointly developed by the Bank for International Settlements (BIS), the International Monetary Fund (IMF), the Organization for Economic Cooperation and Development (OECD) and the World Bank (WB)-brings together external debt data and selected foreign assets from international creditor/market and national debtor sources. The JEDH replaces the Joint BIS-IMF-OECD-WB Statistics on External Debt, a website that was launched in 1999 to provide international data, mainly from creditor sources, on the external debt of developing and transition countries and territories.
- L
-
Декабрь 2017Источник: Ministry of Economy, UAEЗагружен: KnoemaДата обращения к источнику: 17 мая, 2018Выбрать
-
Февраль 2019Источник: International Labour OrganizationЗагружен: KnoemaДата обращения к источнику: 15 февраля, 2019ВыбратьThis indicator provides the ratio of dependents (persons aged 0 to 14 + persons aged 15 and above that are either outside the labour force or unemployed) to total employment. The series is calculated based on ILO estimates that are harmonized to account for differences in national data and scope of coverage, collection and tabulation methodologies as well as for other country-specific factors. Data for 1990-2015 are estimates while 2016-2030 data are projections. The dataset was updated as of July 2017. For more information, refer to the ILO estimates and projections methodological note.
-
Февраль 2019Источник: International Labour OrganizationЗагружен: KnoemaДата обращения к источнику: 15 февраля, 2019ВыбратьThe labour force comprises all persons of working age who furnish the supply of labour for the production of goods and services during a specified time-reference period. It refers to the sum of all persons of working age who are employed and those who are unemployed. The series is part of the ILO estimates and is harmonized to account for differences in national data and scope of coverage, collection and tabulation methodologies as well as for other country-specific factors. Data for 1990-2015 are estimates while 2016-2030 data are projections. The dataset was updated as of July 2017. For more information, refer to the general methodological note and the labour force estimates and projections methodological paper.
-
Май 2019Источник: International Labour OrganizationЗагружен: KnoemaДата обращения к источнику: 28 мая, 2019ВыбратьThe labour force comprises all persons of working age who furnish the supply of labour for the production of goods and services during a specified time-reference period. It refers to the sum of all persons of working age who are employed and those who are unemployed.
-
Февраль 2019Источник: International Labour OrganizationЗагружен: KnoemaДата обращения к источнику: 15 февраля, 2019ВыбратьThe labour force comprises all persons of working age who furnish the supply of labour for the production of goods and services during a specified time-reference period. It refers to the sum of all persons of working age who are employed and those who are unemployed. The series is part of the ILO estimates and is harmonized to account for differences in national data and scope of coverage, collection and tabulation methodologies as well as for other country-specific factors. For more information, refer to the general methodological note and the labour force estimates and projections methodological paper.
-
Февраль 2019Источник: International Labour OrganizationЗагружен: KnoemaДата обращения к источнику: 15 февраля, 2019ВыбратьThe labour force comprises all persons of working age who furnish the supply of labour for the production of goods and services during a specified time-reference period. It refers to the sum of all persons of working age who are employed and those who are unemployed. The series is part of the ILO estimates and is harmonized to account for differences in national data and scope of coverage, collection and tabulation methodologies as well as for other country-specific factors. Data for 1990-2015 are estimates while 2016-2030 data are projections. The dataset was updated as of July 2017. For more information, refer to the general methodological note and the labour force estimates and projections methodological paper.
-
Май 2019Источник: International Labour OrganizationЗагружен: KnoemaДата обращения к источнику: 21 мая, 2019ВыбратьThe labour force participation rate is the labour force as a percent of the working age population.
-
Февраль 2019Источник: International Labour OrganizationЗагружен: KnoemaДата обращения к источнику: 15 февраля, 2019ВыбратьThe labour force comprises all persons of working age who furnish the supply of labour for the production of goods and services during a specified time-reference period. It refers to the sum of all persons of working age who are employed and those who are unemployed. The series is part of the ILO estimates and is harmonized to account for differences in national data and scope of coverage, collection and tabulation methodologies as well as for other country-specific factors. For more information, refer to the general methodological note and the labour force estimates and projections methodological paper.
-
Апрель 2019Источник: Organisation for Economic Co-operation and DevelopmentЗагружен: KnoemaДата обращения к источнику: 15 апреля, 2019Выбрать
-
Ноябрь 2018Источник: International Labour OrganizationЗагружен: KnoemaДата обращения к источнику: 21 ноября, 2018ВыбратьThis indicator is a proxy for rights to social security and health. It represents the percentage of the population without legal health coverage. Coverage includes affiliated members of health insurance or estimation of the population having free access to health care services provided by the State. A higher figure indicates higher percentage of the population without legal health coverage.This is one of five indicators measuring key dimensions of deficits in health care access and coverage. For analytical purposes the full set of indicators should be considered together.
-
Июнь 2018Источник: Legatum InstituteЗагружен: KnoemaДата обращения к источнику: 11 декабря, 2018Выбрать
-
Май 2019Источник: Bank for International SettlementsЗагружен: KnoemaДата обращения к источнику: 06 мая, 2019ВыбратьLocational Banking Statistics : Cross-Border Positions, by Residence and Sector of Counterparty
-
Май 2018Источник: World BankЗагружен: KnoemaДата обращения к источнику: 03 августа, 2018ВыбратьThe Logistics Performance Index overall score reflects assessments of a country's logistics based on efficiency of the customs clearance process, quality of trade- and transport-related infrastructure, ease of arranging competitively priced shipments, quality of logistics services, ability to track and trace consignments, and frequency with which shipments reach the consignee within the scheduled time. The index ranges from 1 to 5, with a higher score representing better performance. Data are from Logistics Performance Index surveys conducted by the World Bank in partnership with academic and international institutions and private companies and individuals engaged in international logistics. 2011 round of surveys covered more than 6,000 country assessments by nearly 1,000 international freight forwarders. Respondents evaluated eight markets on six core dimensions using a scale from 1 (worst) to 5 (best). The markets are chosen based on the most important export and import markets of the respondent's country, random selection, and, for landlocked countries, neighboring countries that connect them with international markets. Scores for the six areas are averaged across all respondents and aggregated to a single score using principal components analysis. Details of the survey methodology and index construction methodology are in Connecting to Compete 2012: Trade Logistics in the Global Economy (2012).
- M
-
Март 2018Источник: Food and Agriculture OrganizationЗагружен: KnoemaДата обращения к источнику: 27 мая, 2019ВыбратьThe FAOSTAT Macro Indicators database provides a selection of country-level macroeconomic indicators taken from National Accounts series and relating to total economy (TE), Agriculture, Forestry and Fishing (AFF), Manufacturing (MAN), and Manufacturing of Food, beverage and tobacco products (FBT). All data relating to Total Economy, Agriculture, Forestry and Fishing, and Total Manufacturing originates from the United Nations Statistics Division (UNSD) which maintains and annually updates the "National Accounts Estimates of Main Aggregates" database. It consists of a complete and consistent set of time series of the main National Accounts (NA) aggregates of all UN Members States and other territories in the world for which National Accounts information is available. The UNSD database's content is based on the countries' official NA data reported to UNSD through the annual National Accounts Questionnaire, supplemented with data estimates for any years and countries with incomplete or inconsistent information. FAOSTAT Macro Indicators database reproduces a selection of time series from the UNSD National Accounts Estimates of Main Aggregates such as GDP, GFCF and sectoral VA. Additional analytical indicators such as annual per capita GDP (calculated using annual population series from the UNSD) and annual growth rates for GDP, GFCF and VA are included toghether with the investment ratio GFCF/GDP and the sectors'contribution to total economy GDP. Series on value added on Manufacture of Food, Beverages and Tobacco products originates - in order of priority - from OECD Annual National Accounts and UNIDO INDSTAT2 databases. In order to ensure that sub-industry series are consistent in levels with National Accounts based series, which is needed to support comparability across industries (agriculture vs. agro-industry and sub-industries), we proceed to a rescaling exercise of UNIDO originating series on UNSD National Accounts Estimates of Main Aggregates data series.
-
Июнь 2018Источник: Center for Systemic PeaceЗагружен: KnoemaДата обращения к источнику: 25 октября, 2018ВыбратьCenter for Systemic Peace, Major Episodes of Political Violence, 1946-2017 (War List), Annual Set lists annual, cross-national, time-series data on interstate, societal, and communal warfare magnitude scores (independence, interstate, ethnic, and civil; violence and warfare) for all countries; Full Set (1946-2012) includes both country data and scores for neighboring countries and regional context for all independent countries (does not include independence wars)
-
Декабрь 2011Источник: African Development Bank GroupЗагружен: KnoemaДата обращения к источнику: 12 декабря, 2011ВыбратьMaking Finance Work for Africa
-
Февраль 2019Источник: International Labour OrganizationЗагружен: KnoemaДата обращения к источнику: 15 февраля, 2019ВыбратьThe labour force comprises all persons of working age who furnish the supply of labour for the production of goods and services during a specified time-reference period. It refers to the sum of all persons of working age who are employed and those who are unemployed. The working-age population is commonly defined as persons aged 15 years and older, but this varies from country to country. The series is part of the ILO estimates and is harmonized to account for differences in national data and scope of coverage, collection and tabulation methodologies as well as for other country-specific factors. Data for 1990-2015 are estimates while 2016-2030 data are projections. The dataset was updated as of July 2017. For more information, refer to the ILO estimates and projections methodological note.
-
Июль 2014Источник: Organisation for Economic Co-operation and DevelopmentЗагружен: Pallavi SДата обращения к источнику: 05 августа, 2014ВыбратьThe Maritime Transport Costs (MTC)database contains data from 1991 to the most recent available year of bilateral maritime transport costs. Transport costs are available for 43 importing countries (including EU15 countries as a custom union) from 218 countries of origin at the detailed commodity (6 digit) level of the Harmonized System 1988. This dataset should only be used in conjunction with the paper Clarifying Trade Costs in Maritime Transport which outlines methodology, data coverage and caveats to its use. Key Statistical Concept Import charges represent the aggregate cost of all freight, insurance and other charges (excluding import duties) incurred in bringing the merchandise from alongside the carrier at the port of export and placing it alongside the carrier at the first port of entry in the importing country. Insurance charges are therefore included in the transport cost variables and are estimated to be approximately 1.5% of the import value of the merchandise.
-
Август 2018Источник: International Labour OrganizationЗагружен: KnoemaДата обращения к источнику: 31 августа, 2018ВыбратьThis indicator is a proxy for health system outcomes. It represents the number of maternal deaths per 10 000 live births. A higher figure indicates worse outcomes. This is one of five indicators measuring key dimensions (drivers) of deficits in health care access and coverage. For analytical purposes the full set of indicators should be considered together.
-
Декабрь 2015Источник: World BankЗагружен: Mikhail ZhukovskiiДата обращения к источнику: 08 декабря, 2015Выбрать
-
Декабрь 2018Источник: International Telecommunication UnionЗагружен: KnoemaДата обращения к источнику: 14 декабря, 2018ВыбратьThis Dataset contains Indicators related to IC Development Index and Tables from "Measuring the Information Society Report 2018, Volume 1" For Indicators for other ICT Development data please refer: https://knoema.com/ITUKIICT2019/global-ict-developments
-
Февраль 2019Источник: International Labour OrganizationЗагружен: KnoemaДата обращения к источнику: 15 февраля, 2019ВыбратьThe median age marks the point where half the group is older than that age and half is younger. The labour force comprises all persons of working age who furnish the supply of labour for the production of goods and services during a specified time-reference period. It refers to the sum of all persons of working age who are employed and those who are unemployed. The series is part of the ILO estimates and is harmonized to account for differences in national data and scope of coverage, collection and tabulation methodologies as well as for other country-specific factors. Data for 1990-2015 are estimates while 2016-2030 data are projections. The dataset was updated as of July 2017. For more information, refer to the general methodological note and the labour force estimates and projections methodological paper.
-
Май 2019Источник: General Authority for Statistics, Kingdom of Saudi ArabiaЗагружен: KnoemaДата обращения к источнику: 13 мая, 2019Выбрать
-
Март 2019Источник: United Nations COMTRADEЗагружен: KnoemaДата обращения к источнику: 28 марта, 2019Выбрать
-
Январь 2015Источник: United Nations Conference on Trade and DevelopmentЗагружен: KnoemaДата обращения к источнику: 23 апреля, 2015ВыбратьThis table presents merchandise trade complementarity index which assesses the suitability of preferential trade agreement between two economies given the structure of one potential partners’ exports match the imports of the other potential partner. Changes over time may indicate whether the trade profiles are becoming more or less compatible.
-
Ноябрь 2018Источник: United Nations Conference on Trade and DevelopmentЗагружен: KnoemaДата обращения к источнику: 20 декабря, 2018ВыбратьMerchandise: Trade value, volume, unit value, terms of trade indices and purchasing power index of exportsThis dataset contains export and import volume indices, rounding out trade value. Export and import unit value indices, derived terms of trade and purchasing power of exports indices are also provided in various base and reference years (2000, 2010 and 2015).The value index is the current value of exports (FOB) or imports (CIF) converted to United States dollars and expressed in percentage. The volume index is derived as the percentage ratio of the export or import value index to the corresponding unit value index (value index / unit value index *100) unless otherwise noted at country level.The weights used for the calculation of the indices correspond to base year 2000. For convenience, and to facilitate international comparisons, the series have been rescaled to new references 2010=100 and 2015=100.
-
Октябрь 2018Источник: United Nations Conference on Trade and DevelopmentЗагружен: KnoemaДата обращения к источнику: 26 октября, 2018ВыбратьMerchandise trade matrix - detailed products, exports and imports in thousands of United States dollars, annual This dataset presents merchandise trade by trading partner and product based on three digit level SITC Revision 3 commodity classification, expressed in thousands of dollars. In addition, data are also summarized by geographical region, economic and trade grouping, for both reporting country and its trading partner, and by product grouping.
-
Октябрь 2018Источник: United Nations Conference on Trade and DevelopmentЗагружен: KnoemaДата обращения к источнику: 30 октября, 2018Выбрать
-
Октябрь 2018Источник: United Nations Conference on Trade and DevelopmentЗагружен: KnoemaДата обращения к источнику: 26 октября, 2018ВыбратьMerchandise Trade Matrix – Product Groups, Exports and Imports in Thousands of dollars This table presents merchandise trade by trading partner and product based on the SITC commodity classification, Revision 3, at the one- and two-digit level, expressed in thousands of United States dollars. The data are also summarized by group of economies, for both reporting economy and trading partner, and by broader product groups.
-
Октябрь 2018Источник: United Nations Conference on Trade and DevelopmentЗагружен: KnoemaДата обращения к источнику: 04 декабря, 2018ВыбратьThis Dataset presents product concentration and diversification indices. The diversification index indicates whether the structure of exports or imports by product of a given country or country group differs from the world pattern. The product concentration index shows how exports and imports of individual countries or country groups are concentrated on a few products or otherwise distributed in a more homogeneous manner among a series of products.
-
Апрель 2019Источник: United Nations Conference on Trade and DevelopmentЗагружен: KnoemaДата обращения к источнику: 15 апреля, 2019ВыбратьThis dataset shows the value of total merchandise exports and imports, expressed in millions of United States dollars and percentages of the world total
-
Январь 2015Источник: Right DiagnosisЗагружен: KnoemaДата обращения к источнику: 04 февраля, 2016Выбрать
-
Февраль 2019Источник: National Institute of Statistics, ItalyЗагружен: KnoemaДата обращения к источнику: 01 марта, 2019ВыбратьData source(s) used: Persons registered in and cancelled from the population register due to change of residence:The English description of the source is not available at this time, for methodological details go to the Siqual system
-
Апрель 2019Источник: World BankЗагружен: KnoemaДата обращения к источнику: 06 мая, 2019ВыбратьMigration and Remittances Fact book provides a snapshot of migration and remittances for all countries, regions and income groups of the world, compiled from available data from various sources.
-
Июнь 2018Источник: Statistics NetherlandsЗагружен: KnoemaДата обращения к источнику: 02 декабря, 2018ВыбратьImmigration and emigration in the Netherlands and the administrative corrections by country of birth, sex, age and marital status. Data available from: 1995 Status of the figures: All data recorded in this publication are final data. Changes as from 18 June 2018: The final figures of 2017 have been added. Changes as from 26 April 2018: The underlying coding of classifications used in this table has been adjusted. It is now in line with the standard encoding defined by CBS. The structure and data of the table have been adjusted. The age classification has been simplified: the five-year groups have been removed. This makes the table better suited for the interface of the new StatLine. If you are missing these figures, please contact Infoservice (see section 5). When will new figures be published? The final figures of 2018 will be added in the second quarter of 2019 in this publication.
-
Март 2019Источник: World BankЗагружен: KnoemaДата обращения к источнику: 20 марта, 2019ВыбратьData cited at: The World Bank https://datacatalog.worldbank.org/ Topic: Millennium Development Goals Publication: https://datacatalog.worldbank.org/dataset/millennium-development-goals License: http://creativecommons.org/licenses/by/4.0/ Relevant indicators drawn from the World Development Indicators, reorganized according to the goals and targets of the Millennium Development Goals (MDGs). The MDGs focus the efforts of the world community on achieving significant, measurable improvements in people's lives by the year 2015: they establish targets and yardsticks for measuring development results. Gender Parity Index (GPI)= Value of indicator for Girls/ Value of indicator for Boys. For e.g GPI=School enrolment for Girls/School enrolment for Boys. A value of less than one indicates differences in favor of boys, whereas a value near one (1) indicates that parity has been more or less achieved. The greater the deviation from 1 greater the disparity is.
-
Декабрь 2018Источник: Organisation for Economic Co-operation and DevelopmentЗагружен: KnoemaДата обращения к источнику: 11 декабря, 2018ВыбратьAir pollution is considered one of the most pressing environmental and health issues across OECD countries and beyond. According to the World Health Organisation (WHO), exposure to fine particulate matter (PM2.5) and ground-level ozone (O3) have potentially the most significant adverse effects on health compared to other pollutants. PM2.5 can be inhaled and cause serious health problems including both respiratory and cardiovascular disease, having its most severe effects on children and elderly people. Exposure to PM2.5 has been shown to considerably increase the risk of heart disease and stroke in particular. For these reasons, population exposure to (outdoor or ambient) PM2.5 has been identified as an OECD Green Growth headline indicator. Exposure to ground-level ozone (O3) has serious consequences for human health, contributing to, or triggering, respiratory diseases. These include breathing problems, asthma and reduced lung function (WHO, 2016; Brauer et al., 2016). Ozone exposure is highest in emission-dense countries with warm and sunny summers. The most important determinants are background atmospheric chemistry, climate, anthropogenic and biogenic emissions of ozone precursors such as volatile organic compounds, and the ratios between different emitted chemicals.
-
Февраль 2016Источник: Pew Research CenterЗагружен: KnoemaДата обращения к источнику: 05 февраля, 2016ВыбратьNotes : 2010 is Estimated Population, 2030 is Projected Population.
- N
-
Июнь 2017Источник: Namibia Statistics AgencyЗагружен: KnoemaДата обращения к источнику: 22 февраля, 2018ВыбратьNamibia Trade statistics, 2016
-
Декабрь 2018Источник: United Nations Statistics DivisionЗагружен: KnoemaДата обращения к источнику: 04 марта, 2019ВыбратьThe National Accounts Main Aggregates Database presents a series of analytical national accounts tables from 1970 onwards for more than 200 countries and areas of the world. It is the product of a global cooperation effort between the Economic Statistics Branch of the United Nations Statistics Division, international statistical agencies and the national statistical services of these countries and is developed in accordance with the recommendation of the Statistical Commission at its first session in 1947 that the Statistics Division should publish regularly the most recent available data on national accounts for as many countries and areas as possible. The database is updated in December of each year with newly available national accounts data for all countries and areas.
-
Октябрь 2017Источник: United Nations Statistics DivisionЗагружен: KnoemaДата обращения к источнику: 09 ноября, 2017ВыбратьDifferent series numbers (column “Series”) are used to store different time-series versions of national accounts statistics. Series numbers with two digits (10,20) refer to data compiled following the SNA 1968 national accounts methodology, while series numbers with three digits (100, 200, etc) refer to data compiled using the SNA 1993 national accounts methodology whereas series number with four digits (1000, 1100) refer to data compiled using the SNA 2008 national accounts methodology. In addition to different methodologies, different series numbers are used when data are reported in different currencies, fiscal years, or by different sources. Furthermore, data are stored under a new series number whenever there are significant changes in compilation practices which make the time series no longer comparable. Note: Ethiopia [upto 1993] and Ethiopia [from 1993] merged to get Ethiopia, Similarly Sudan (upto 2011) is combined with Sudan.
-
Апрель 2019Источник: International Labour OrganizationЗагружен: KnoemaДата обращения к источнику: 21 мая, 2019ВыбратьThis indicator shows the percentage change of the CPI between a month and the same month of the previous year. In cases where the period of reference is a quarter, data refers to the percentage change from the same quarter of the previous year.
-
Февраль 2019Источник: World Health OrganizationЗагружен: KnoemaДата обращения к источнику: 08 февраля, 2019ВыбратьNational Health Accounts (NHA) provides evidence to monitor trends in health spending for all sectors- public and private, different health care activities, providers, diseases, population groups and regions in a country. It helps in developing nationals
-
Март 2016Источник: African Development Bank GroupЗагружен: KnoemaДата обращения к источнику: 24 октября, 2016Выбрать3The Africa Infrastructure Country Diagnostic (AICD) was an unprecedented knowledge program on Africa’s infrastructure that grew out of the pledge by the G8 Summit of 2005 at Gleneagles to substantially increase ODA assistance to Africa, particularly to the infrastructure sector, and the subsequent formation of the Infrastructure Consortium for Africa (ICA). The AICD study was founded on the recognition that sub-Saharan Africa (SSA) suffers from a very weak infrastructural base, and that this is a key factor in the SSA region failing to realize its full potential for economic growth, international trade, and poverty reduction. The study broke new ground, with primary data collection efforts covering network service infrastructures (ICT, power, water & sanitation, road transport, rail transport, sea transport, and air transport) from 2001 to 2006 in 24 selected African countries. Between them, these countries account for 85 percent of the sub-Saharan Africa population, GDP, and infrastructure inflows. The countries included in the initial study were: Benin, Burkina Faso, Cameroon, Cape Verde, Chad, Côte d’Ivoire, Democratic Republic of Congo, Ethiopia, Ghana, Kenya, Lesotho, Madagascar, Malawi, Mozambique, Namibia, Niger, Nigeria, Rwanda, South Africa, Senegal, Sudan, Tanzania, Uganda, and Zambia. The study also represents an unprecedented effort to collect detailed economic and technical data on African infrastructure in relation to the fiscal costs of each of the sectors, future sector investment needs, and sector performance indicators. As a result, it has been possible for the first time to portray the magnitude of the continent’s infrastructure challenges and to provide detailed and substantiated estimates on spending needs, funding gaps, and the potential efficiency dividends to be derived from policy reforms.
-
Октябрь 2015Источник: Water FootPrint NetworkЗагружен: KnoemaДата обращения к источнику: 26 октября, 2015ВыбратьData cited at: The Water Footprint Network https://waterfootprint.org/en/ Topic: National water footprint statistics Publication: https://waterfootprint.org/en/resources/waterstat/national-water-footprint-statistics/ Water footprints of national consumption (1996-2005) Reference: Hoekstra, A.Y. & Mekonnen, M.M. (2012) 'The water footprint of humanity’, Proceedings of the National Academy of Sciences, 109(9): 3232–3237. Water footprints of national production (1996-2005) Reference: Hoekstra, A.Y. & Mekonnen, M.M. (2012) 'The water footprint of humanity’, Proceedings of the National Academy of Sciences, 109(9): 3232–3237. License: https://creativecommons.org/licenses/by-sa/3.0/
-
Январь 2013Источник: Maddison ProjectЗагружен: KnoemaДата обращения к источнику: 20 октября, 2015ВыбратьThe Maddison Project has launched an updated version of the original Maddison dataset in January 2013. The update incorporates much of the latest research in the field, and presents new estimates of economic growth in the world economic between AD 1 and 2010. The new estimates are presented and discussed in Bolt and Van Zanden (2014). The Maddison Project: collaborative research on historical national accounts. The Economic History Review, 67 (3): 627–651.
-
Май 2019Источник: Statistics CanadaЗагружен: KnoemaДата обращения к источнику: 25 мая, 2019Выбрать
-
Август 2018Источник: The National Committee on North KoreaЗагружен: KnoemaДата обращения к источнику: 13 августа, 2018Выбрать
-
Norwegian controlled ships. Port calls, by registry, country, part of the world and trading region 2004 - 2017, NorwayАпрель 2018Источник: Statistics NorwayЗагружен: KnoemaДата обращения к источнику: 03 апреля, 2019ВыбратьMajor change in coverage in 2011. Consult About the statistics Only vessels at or above 1 000 gross tonnage. No fishing vessels.
-
Май 2019Источник: Armed Conflict Location and Event Data ProjectЗагружен: KnoemaДата обращения к источнику: 14 мая, 2019Выбрать
-
Май 2019Источник: International Labour OrganizationЗагружен: KnoemaДата обращения к источнику: 24 мая, 2019ВыбратьA strike is a temporary work stoppage carried out by one or more groups of workers with a view to enforcing or resisting demands or expressing grievances, or supporting other workers in their demands or grievances. A lockout is a total or partial temporary closure of one or more places of employment, or the hindering of the normal work activities of employees, by one or more employers with a view to enforcing or resisting demands or expressing grievances, or supporting other employers in their demands or grievances. Data are disaggregated by economic activity according to the latest version of the International Standard Industrial Classification of All Economic Activities (ISIC) available for that year. Economic activity refers to the main activity of the establishment in which a person worked during the reference period and does not depend on the specific duties or functions of the person's job, but on the characteristics of the economic unit in which this person works.
- O
-
Май 2019Источник: Organisation for Economic Co-operation and DevelopmentЗагружен: KnoemaДата обращения к источнику: 06 мая, 2019Выбрать
-
Апрель 2019Источник: Organisation for Economic Co-operation and DevelopmentЗагружен: KnoemaДата обращения к источнику: 12 апреля, 2019ВыбратьThis OECD inventory maps existing cross-country surveys that provide information on the characteristics of people's jobs. The information included in this inventory covers international surveys conducted since the early 1990s that are based on individuals' self-reported assessment of their current job, for 160 countries over 25 years. Survey questions are grouped into 19 indicators. For each indicator, binary codes (1 and 0) show whether indicators are available or not for the various countries and years. The inventory also provides users with detailed documentation on the questions used in the various surveys for measuring these indicators.
-
Октябрь 2013Источник: United Nations Conference on Trade and DevelopmentЗагружен: KnoemaДата обращения к источнику: 29 октября, 2013ВыбратьThis table gives information on official financial flows by type and sources. It is further broken down by individual country, geographical region and economic grouping (as recipients); and expressed in millions of dollars, as percentage of total flows and as percentage of region.
-
Июнь 2018Источник: Statistics FinlandЗагружен: KnoemaДата обращения к источнику: 29 ноября, 2018ВыбратьData cited at: Statistics Finland http://www.stat.fi/index_en.html Publication: 032 -- Origin and background country by sex, by region and municipality in 1990 to 2017 http://pxnet2.stat.fi/PXWeb/pxweb/en/StatFin/StatFin__vrm__vaerak/statfin_vaerak_pxt_032.px License: http://creativecommons.org/licenses/by/4.0/ Concepts and definitions Description Quality description These statistics apply the regional division of 1 January 2018 to the whole time series. Population statistics from 1750 to 2000 have been digitised into PDF format in the National Library's Doria service. Publications on Population structure and vital statistics in Doria (in Finnish) Publications on Population censuses in Doria (in Finnish) Area For reasons of privacy protection, cells with less than 10 cases of citizenship, country of birth, background country or language by municipality have been marked with two dots. Continent sums have not been hidden in municipality data nor have regional data concerning individual languages or countries. Background country Background country data are explained in the Concepts webpage, see link
-
Май 2019Источник: Organisation for Economic Co-operation and DevelopmentЗагружен: KnoemaДата обращения к источнику: 29 мая, 2019ВыбратьOther official flows are official sector transactions which do not meet the ODA criteria, e.g.: i.) Grants to developing countries for representational or essentially commercial purposes; ii.) Official bilateral transactions intended to promote development but having a grant element of less than 25 per cent; iii.) Official bilateral transactions, whatever their grant element, that are primarily export-facilitating in purpose. This category includes by definition export credits extended directly to an aid recipient by an official agency or institution ("official direct export credits"); iv.) The net acquisition by governments and central monetary institutions of securities issued by multilateral development banks at market terms; v.) Subsidies (grants) to the private sector to soften its credits to developing countries [see Annex 3, paragraph A3.5.iv)b)]; vi.) Funds in support of private investment.
-
Август 2018Источник: International Labour OrganizationЗагружен: KnoemaДата обращения к источнику: 31 августа, 2018ВыбратьThis indicator is a proxy for financial protection in case of ill health. It represents the amount of money paid directly to health care providers in exchange for health goods and services as a percentage of total health expenditure. A higher figure indicates higher percentage of out-of-pocket payments. This is one of five indicators measuring key dimensions of deficits in health care access and coverage. For analytical purposes the full set of indicators should be considered together.
-
Октябрь 2015Источник: International Monetary FundЗагружен: KnoemaДата обращения к источнику: 27 октября, 2015ВыбратьCommodity prices have declined sharply over the past three years, and output growth has slowed considerably among those emerging market and developing economies that are net exporters of commodities. A critical question for policymakers in these countries is whether commodity windfall gains and losses influence potential output or merely trigger transient fluctuations of actual output around an unchanged trend for potential output. The analysis in this chapter suggests that both actual and potential output move together with the commodity terms of trade but that actual output commoves twice as strongly as potential output. The weak commodity price outlook is estimated to subtract almost 1 percentage point annually from the average rate of economic growth in commodity exporters over 2015–17 as compared with 2012–14. In exporters of energy commodities, the drag is estimated to be larger: about 2¼ percentage points on average over the same period. The projected drag on the growth of potential output is about one-third of that for actual output.
-
Февраль 2019Источник: International Labour OrganizationЗагружен: KnoemaДата обращения к источнику: 15 февраля, 2019ВыбратьThis measure of labour productivity is calculated using data on GDP in constant 2010 US dollars derived from the World Development Indicators database of the World Bank. To compute labour productivity as GDP per worker, ILO estimates for total employment are used.
-
Февраль 2019Источник: International Labour OrganizationЗагружен: KnoemaДата обращения к источнику: 15 февраля, 2019ВыбратьThis measure of labour productivity is calculated using data on GDP (in constant 2011 international dollars in PPP) derived from the World Development Indicators database of the World Bank. To compute labour productivity as GDP per worker, ILO estimates for total employment are used.
-
Июнь 2017Источник: Organisation for Economic Co-operation and DevelopmentЗагружен: KnoemaДата обращения к источнику: 06 ноября, 2017ВыбратьThis table contains figures on the activity of affiliates located abroad by host country in the total manufacturing, total services and total business enterprise sectors. The units used to present data in AMNE are millions of national currency for monetary variables and units for the other variables. Monetary variables are in current prices. Euro-area countries: national currency data is expressed in euro beginning with the year of entry into the Economic and Monetary Union (EMU). For years prior to the year of entry into EMU, data have been converted from the former national currency using the appropriate irrevocable conversion rate. This presentation facilitates comparisons within a country over time and ensures that the historical evolution is preserved. Please note, however, that pre-EMU euro are a notional unit and should not be used to form area aggregates or to carry out cross-country comparisons.
-
Апрель 2019Источник: Organisation for Economic Co-operation and DevelopmentЗагружен: KnoemaДата обращения к источнику: 12 апреля, 2019Выбрать
-
Февраль 2019Источник: International Labour OrganizationЗагружен: KnoemaДата обращения к источнику: 15 февраля, 2019ВыбратьThe series is part of the ILO estimates and is harmonized to account for differences in national data and scope of coverage, collection and tabulation methodologies as well as for other country-specific factors. For more information, refer to the ILO estimates and projections methodological note.
- P
-
Декабрь 2018Источник: Passport IndexЗагружен: KnoemaДата обращения к источнику: 17 декабря, 2018ВыбратьPassport Index is an interactive tool, which collects, displays and ranks the passports of the world. You can discover the world’s passports on a map, by country name, by Passport Power Rank and even by the color of their cover. Visa Free Score Passports accumulate points for each visa free country that their holders can visit without a visa, or they can obtain a visa on arrival. Passport Power Rank Passports are ranked based on their Visa Free Score. The higher the Visa Free Score, the better the Passport Power Rank. Methodology The country list is based on the 193 UN member countries and 6 territories (Macao, Kosovo, etc.) for a total of 199. Territories annexed to other countries such as Norfolk Island, French Polynesia, etc. are excluded. Data is based on research from publicly available sources, as well as information shared by government agencies.
-
Декабрь 2018Источник: World Intellectual Property OrganizationЗагружен: KnoemaДата обращения к источнику: 11 декабря, 2018ВыбратьData cited at: "WIPO statistics database" which is made available under a BY 3.0 IGO License Total Patent Applications Total Count by Applicant's Origin Zaire, officially the Republic of Zaire, was the name of Democratic Republic of the Congo between 1971 and 1997.
-
Март 2019Источник: Organisation for Economic Co-operation and DevelopmentЗагружен: KnoemaДата обращения к источнику: 13 марта, 2019ВыбратьThe OECD Environment Directorate, in collaboration with the Directorate for Science, Technology and Innovation, has developed patent-based innovation indicators that are suitable for tracking developments in environment-related technologies. The indicators allow the assessment of countries' and firms' innovative performance as well as the design of governments' environmental and innovation policies. The patent statistics presented here are constructed using data extracted from the Worldwide Patent Statistical Database (PATSTAT) of the European Patent Office (EPO) using algorithms developed by the OECD. Consistent with other patent statistics provided in OECD.Stat, only published applications for "patents of invention" are considered (i.e. excluding utility models, petty patents, etc.). The relevant patent documents are identified using search strategies for environment-related technologies (ENV-TECH) which were developed specifically for this purpose. They allow identifying technologies relevant to environmental management, water-related adaptation and climate change mitigation. An aggregate category labelled "selected environment-related technologies" includes all of the environmental domains presented here.
-
Март 2019Источник: Organisation for Economic Co-operation and DevelopmentЗагружен: KnoemaДата обращения к источнику: 05 марта, 2019ВыбратьThe OECD Environment Directorate, in collaboration with the Directorate for Science, Technology and Innovation, has developed patent-based innovation indicators that are suitable for tracking developments in environment-related technologies. The indicators allow the assessment of countries' and firms' innovative performance as well as the design of governments' environmental and innovation policies. The patent statistics presented here are constructed using data extracted from the Worldwide Patent Statistical Database (PATSTAT) of the European Patent Office (EPO) using algorithms developed by the OECD. Consistent with other patent statistics provided in OECD.Stat, only published applications for "patents of invention" are considered (i.e. excluding utility models, petty patents, etc.). The relevant patent documents are identified using search strategies for environment-related technologies (ENV-TECH) which were developed specifically for this purpose. They allow identifying technologies relevant to environmental management, water-related adaptation and climate change mitigation. An aggregate category labelled "selected environment-related technologies" includes all of the environmental domains presented here.
-
Февраль 2019Источник: Organisation for Economic Co-operation and DevelopmentЗагружен: KnoemaДата обращения к источнику: 22 февраля, 2019ВыбратьThe OECD Environment Directorate, in collaboration with the Directorate for Science, Technology and Innovation, has developed patent-based innovation indicators that are suitable for tracking developments in environment-related technologies. The indicators allow the assessment of countries' and firms' innovative performance as well as the design of governments' environmental and innovation policies. The patent statistics presented here are constructed using data extracted from the Worldwide Patent Statistical Database (PATSTAT) of the European Patent Office (EPO) using algorithms developed by the OECD. Consistent with other patent statistics provided in OECD.Stat, only published applications for "patents of invention" are considered (i.e. excluding utility models, petty patents, etc.). The relevant patent documents are identified using search strategies for environment-related technologies (ENV-TECH) which were developed specifically for this purpose. They allow identifying technologies relevant to environmental management, water-related adaptation and climate change mitigation. An aggregate category labelled "selected environment-related technologies" includes all of the environmental domains presented here.
-
Апрель 2019Источник: University of Groningen, NetherlandsЗагружен: KnoemaДата обращения к источнику: 23 мая, 2019ВыбратьPWT version 9.1 is a database with information on relative levels of income, output, input and productivity, covering 182 countries between 1950 and 2017.
-
Percentage of health care expenditure not financed by private households' out of pocket payments (%)Сентябрь 2014Источник: International Labour OrganizationЗагружен: KnoemaДата обращения к источнику: 31 августа, 2018ВыбратьDescription not available
-
Ноябрь 2018Источник: United Nations Conference on Trade and DevelopmentЗагружен: KnoemaДата обращения к источнику: 27 декабря, 2018ВыбратьThis Dataset presents time series on receipts and payments of personal remittances in millions of dollars. These data are also shown as percentage of exports (receipts) and imports (payments) of goods and services, and as percentage of GDP. Personal remittances, as defined in this table, comply with the guidelines of the Balance of Payments and International Investment Position Manual, Sixth Edition (BPM6) (IMF 2009, Appendix 5). They are the sum of two items: (1.) compensation of employees, defined as the income of workers employed in an economy where they are not resident and of residents employed by non-resident employers; (2.) personal (current) transfers, defined as current transfers in kind or in cash, between resident and non-resident households (ibid., A5.5-7). A broader definition of personal remittances would include also capital transfers between resident and non-resident households (ibid., A5.10-13). However, data coverage for capital transfers is much sparser than for the two items above, as compilation of this item by countries is voluntary in the context of the balance of payment statistics. Therefore, capital transfers between resident and non-resident households are reported in this table separately. The main source of personal remittances data is World Bank. In cases of missing data, data from IMF or Economic Intelligence Unit have been imputed. Capital transfers data have been taken from IMF.
-
Март 2019Источник: National Institute of Statistics, ItalyЗагружен: KnoemaДата обращения к источнику: 04 марта, 2019ВыбратьData source(s) used: Persons convicted for crime with irrevocable judgement: Survey on convicted persons for felony and misdemeanor with irrevocable judgement, type of crimes and misdemeanors committed, main features of the convicted persons and of the sentence. Other data characteristics: The number of persons convicted by type of crime is calculated on the most serious crime committed. The number of convicted persons by final judgement and the number of crimes is available with reference to two types of classifications. An analytical classification including about 470 items of crime, and a synthetic one, where the individual items are hierarchically grouped in 130 items broadly reflecting the Titles, Books and Sections of the Italian Penal Code. The complementary legislation is organized grouping the type of crimes by subject. The analytical classification of the types of crimes committed is given only in Italian language, as many crimes present in the Italian legislation do not have an exact match in the laws of other Countries. The literal translation of this classification is not available because the meaning of the legal terms translated into English could lead to misleading interpretations. An international classification is not available yet. "Number of concurrent crimes" means the total number of crimes committed by the convicted person. "1" means that the offender committed only one kind of crime. "2", "3", "4 and over" mean that, in addition to the most serious crime evident in the table, the offender committed other crimes.
-
Persons outside the labour force as % of working-age population -- ILO modelled estimates, July 2017Февраль 2019Источник: International Labour OrganizationЗагружен: KnoemaДата обращения к источнику: 15 февраля, 2019ВыбратьPersons outside the labour force comprise all persons of working age who, during the specified reference period, were not in the labour force (that is, were not employed or unemployed). The working-age population is commonly defined as persons aged 15 years and older, but this varies from country to country. The series is part of the ILO estimates and is harmonized to account for differences in national data and scope of coverage, collection and tabulation methodologies as well as for other country-specific factors. For more information, refer to the ILO estimates and projections methodological note.
-
Январь 2018Источник: International Labour OrganizationЗагружен: KnoemaДата обращения к источнику: 31 августа, 2018ВыбратьPersons outside the labour force comprise all persons of working age who, during the specified reference period, were not in the labour force (that is, were not employed or unemployed). The series is part of the ILO estimates and is harmonized to account for differences in national data and scope of coverage, collection and tabulation methodologies as well as for other country-specific factors. Data for 1990-2015 are estimates while 2016-2030 data are projections. The dataset was updated as of July 2017. For more information, refer to the labour force estimates and projections methodological paper.
-
Август 2018Источник: Food and Agriculture OrganizationЗагружен: KnoemaДата обращения к источнику: 22 марта, 2019ВыбратьResource Statistics - Pesticides Trade
-
Декабрь 2018Источник: Political Terror ScaleЗагружен: KnoemaДата обращения к источнику: 30 января, 2019Выбратьcitation: Gibney, Mark, Linda Cornett, Reed Wood, Peter Haschke, and Daniel Arnon. 2016. The Political Terror Scale 1976-2015. Date Retrieved, from the Political Terror Scale website: http://www.politicalterrorscale.org. Political Terror Scale Levels 1 - Countries under a secure rule of law, people are not imprisoned for their views, and torture is rare or exceptional. Political murders are extremely rare. 2 - There is a limited amount of imprisonment for nonviolent political activity. However, few persons are affected, torture and beatings are exceptional. Political murder is rare. 3 - There is extensive political imprisonment, or a recent history of such imprisonment. Execution or other political murders and brutality may be common. Unlimited detention, with or without a trial, for political views is accepted. 4 - Civil and political rights violations have expanded to large numbers of the population. Murders, disappearances, and torture are a common part of life. In spite of its generality, on this level terror affects those who interest themselves in politics or ideas. 5 - Terror has expanded to the whole population. The leaders of these societies place no limits on the means or thoroughness with which they pursue personal or ideological goals.
-
Февраль 2019Источник: AfricapolisЗагружен: KnoemaДата обращения к источнику: 12 апреля, 2019ВыбратьData cited at: OECD/SWAC (2018), Africapolis (database), www.africapolis.org (accessed 05 February 2019); (FR):OCDE/CSAO (2018), Africapolis (base de données), www.africapolis.org (consultée le 05 février 2019).
-
Февраль 2019Источник: Statistics SwedenЗагружен: KnoemaДата обращения к источнику: 01 марта, 2019Выбрать
-
Февраль 2019Источник: International Labour OrganizationЗагружен: KnoemaДата обращения к источнику: 11 февраля, 2019ВыбратьThe total population comprises persons of all ages who were living in the country during the reference period, regardless of residency status or citizenship. Data for 1990-2015 are estimates while 2016-2030 data are projections. The dataset was updated as of July 2017, the source for the population figures used is World Population Prospects: The 2017 Revision and the rural urban distribution population source is World Urbanization Prospects: The 2014 Revision issued by the United Nations.
-
Февраль 2019Источник: International Labour OrganizationЗагружен: KnoemaДата обращения к источнику: 11 февраля, 2019ВыбратьThe total population comprises persons of all ages who were living in the country during the reference period, regardless of residency status or citizenship. Data for 1990-2015 are estimates while 2016-2030 data are projections. The dataset was updated as of July 2017, the source for the population figures used is World Population Prospects: The 2017 Revision issued by the United Nations.
-
Февраль 2019Источник: International Labour OrganizationЗагружен: KnoemaДата обращения к источнику: 11 февраля, 2019ВыбратьThe total population comprises persons of all ages who were living in the country during the reference period, regardless of residency status or citizenship. Data for 1990-2015 are estimates while 2016-2030 data are projections. The dataset was updated as of July 2017, the source for the population figures used is World Population Prospects: The 2017 Revision and the rural urban distribution population source is World Urbanization Prospects: The 2014 Revision issued by the United Nations.
-
-
Апрель 2019Источник: World BankЗагружен: KnoemaДата обращения к источнику: 01 мая, 2019ВыбратьData cited at: The World Bank https://datacatalog.worldbank.org/ Topic: Population Estimates And Projections Publication: https://datacatalog.worldbank.org/dataset/population-estimates-and-projections License: http://creativecommons.org/licenses/by/4.0/ This database presents population and other demographic estimates and projections from 1960 to 2050. They are disaggregated by age-group and sex and covers more than 200 economies.
-
Март 2017Источник: United Nations Human Settlements ProgrammeЗагружен: KnoemaДата обращения к источнику: 02 августа, 2017ВыбратьThis dataset covers the topics of Urban population and proportion of urban population living in slum area across countries & regions for the year of 1990-2014
-
Май 2018Источник: Food and Agriculture OrganizationЗагружен: KnoemaДата обращения к источнику: 22 марта, 2019ВыбратьThe FAOSTAT Population module contains time series data on population, by sex and urban/rural. The series consist of both estimates and projections for different periods as available from the original sources, namely: 1. Population data refers to the World Population Prospects: The 2015 Revision from the UN Population Division. 2. Urban/rural population data refers to the World Urbanization Prospects: The 2014 Revision from the UN Population Division. Long term series estimates and projections from 1961 to 2050. http://www.un.org/en/development/desa/population/
-
Август 2013Источник: General Directorate of Statistics, Economic and Social Studies, Central African RepublicЗагружен: KnoemaДата обращения к источнику: 04 августа, 2013ВыбратьSource: RGPH 2003
-
Май 2015Источник: Earth Policy InstituteЗагружен: KnoemaДата обращения к источнику: 26 июня, 2015ВыбратьThis is part of a supporting dataset for Lester R. Brown, Full Planet, Empty Plates: The New Geopolitics of Food Scarcity (New York: W.W. Norton & Company, 2012).
-
Март 2019Источник: World BankЗагружен: KnoemaДата обращения к источнику: 25 апреля, 2019ВыбратьThe World Bank periodically prepares poverty assessments of countries in which it has an active program, in close collaboration with national institutions, other development agencies, and civil society, including poor people's organizations. Assessments report the extent and causes of poverty and propose strategies to reduce it. Countries have varying definitions of poverty, and comparisons can be difficult. National poverty lines tend to have higher purchasing power in rich countries, where standards used are more generous than in poor countries. Poverty measures based on an international poverty line attempt to hold the real value of the poverty line constant across countries, including when making comparisons over time. Data here includes measures of population living below the national poverty line as well as the international poverty line. Also included are income distributions and urban and rural poverty
-
Декабрь 2016Источник: International Telecommunication UnionЗагружен: KnoemaДата обращения к источнику: 02 марта, 2017Выбрать
-
Ноябрь 2018Источник: Organisation for Economic Co-operation and DevelopmentЗагружен: KnoemaДата обращения к источнику: 26 ноября, 2018ВыбратьPrivate transactions are those undertaken by firms and individuals resident in the reporting country.
-
Май 2019Источник: International Labour OrganizationЗагружен: KnoemaДата обращения к источнику: 21 мая, 2019ВыбратьDescription not available
-
Апрель 2019Источник: Organisation for Economic Co-operation and DevelopmentЗагружен: KnoemaДата обращения к источнику: 12 апреля, 2019ВыбратьThis dataset presents activities in support of development from philanthropic foundations since 2009, including bilateral activities and core contributions to multilateral organisations. Bilateral activities from this dataset can also be found in the Creditor Reporting System (CRS) database. Collecting data on private philanthropy for development is work in progress, which may explain break in series for some foundations.
-
Июнь 2015Источник: World BankЗагружен: KnoemaДата обращения к источнику: 25 января, 2017ВыбратьPrivatization Database provides information on privatization transactions of at least US$1 million in developing countries from 2000 to 2008. Prior to this effort the most comprehensive information could be found in the World Bank’s Privatization Transactions database, which covered the years 1988 through 1999.
-
Январь 2019Источник: Food and Agriculture OrganizationЗагружен: KnoemaДата обращения к источнику: 25 января, 2019ВыбратьCropsCrop statistics are recorded for 173 products, covering the following categories: Crops Primary, Fibre Crops Crop statistics are recorded for 173 products, covering the following categories: Crops Primary, Fibre Crops Primary, Cereals, Coarse Grain, Citrus Fruit, Fruit, Jute & Jute-like Fibres, Oilcakes Equivalent, Oil crops Primary, Pulses, Roots and Tubers, Treenuts and Vegetables and Melons. Data are expressed in terms of area harvested, production quantity, yield and seed quantity. The objective is to comprehensively cover production of all primary crops for all countries and regions in the world. Cereals: Area and production data on cereals relate to crops harvested for dry grain only. Cereal crops harvested for hay or harvested green for food, feed or silage or used for grazing are therefore excluded. Area data relate to harvested area. Some countries report sown or cultivated area only; however, in these countries the sown or cultivated area does not differ significantly in normal years from the area actually harvested, either because practically the whole area sown is harvested or because the area surveys are conducted around the harvest period. Vegetables, total (including melons): Data relate to vegetable crops grown mainly for human consumption. Crops such as cabbages, pumpkins and carrots, when explicitly cultivated for animal feed, are therefore excluded. Statistics on vegetables are not available in many countries, and the coverage of the reported data differs from country to country. In general, it appears that the estimates refer to crops grown in field and market gardens mainly for sale, thus excluding crops cultivated in kitchen gardens or small family gardens mainly for household consumption. Fruit, total (excluding melons): Data refer to total production of fresh fruit, whether finally used for direct consumption for food or feed, or processed into different products: dry fruit, juice, jam, alcohol, etc. Generally, production data relate to plantation crops or orchard crops grown mainly for sale. Data on production from scattered trees used mainly for home consumption are not usually collected. Production from wild plants, particularly berries, which is of some importance in certain countries, is generally disregarded by national statistical services. Therefore, the data for the various fruits and berries are rather incomplete. Bananas and plantains: Figures on bananas refer, as far as possible, to all edible fruit-bearing species of the genus Musa except Musa paradisiaca, commonly known as plantain. Unfortunately, several countries make no distinction in their statistics between bananas and plantains and publish only overall estimates. When this occurs and there is some indication or assumption that the data reported refer mainly to bananas, the data are included. The production data on bananas and plantains reported by the various countries are also difficult to compare because a number of countries report in terms of bunches, which generally means that the stalk is included in the weight. Dates, plantains and total grapes are included in the “total fruit” aggregated figures, while olives are excluded. Treenuts: Production of nuts (including chestnuts) relates to nuts in the shell or in the husk. Statistics are very scanty and generally refer only to crops for sale. In addition to the kind of nuts shown separately, production data include all other treenuts mainly used as dessert or table nuts, such as pecan nuts, pili nuts, sapucaia nuts and macadamia nuts. Nuts mainly used for flavouring beverages are excluded as are masticatory and stimulant nuts and nuts used mainly for the extraction of oil or butter, including areca/betel nuts, cola nuts, illipe nuts, karite nuts, coconuts, tung nuts, oilpalm nuts etc. http://www.fao.org/faostat/en/#data/QCCrops processedThe dataset covers the following commodities: Beer of barley; Cotton lint; Cottonseed; Margarine, short; Molasses; Oil, coconut (copra); Oil, cottonseed; Oil, groundnut; Oil, linseed; Oil, maize; Oil, olive, virgin; Oil, palm; Oil, palm kernel; Oil, rapeseed; Oil, safflower; Oil, sesame; Oil, soybean; Oil, sunflower; Palm kernels; Sugar Raw Centrifugal; Wine. http://www.fao.org/faostat/en/#data/QD
-
Февраль 2019Источник: Food and Agriculture OrganizationЗагружен: KnoemaДата обращения к источнику: 03 апреля, 2019ВыбратьThe agricultural production domain covers: Quantity produced Producer price Value at farmgate (forthcoming) Area harvested Yield per hectare
-
Май 2019Источник: U.S. Department of AgricultureЗагружен: KnoemaДата обращения к источнику: 11 мая, 2019ВыбратьUSDA Production, Supply and Distribution dataset contains current and historical official USDA data on production, supply and distribution of agricultural commodities for the United States and key producing and consuming countries.
-
Сентябрь 2018Источник: International Labour OrganizationЗагружен: KnoemaДата обращения к источнику: 24 сентября, 2018ВыбратьThis indicator conveys the proportion of children (defined as persons aged 5 to 17) involved in child labour, as well as the proportion of children involved in employment and the proportion of children involved in hazardous work. Children in employment include all those children who are engaged in any activity falling within the System of National Accounts' production boundary. Child labour is a subgroup of child employment, and it refers to children engaged in prohibited work or in types of work that should be eliminated given that they are injurious, negative or socially or morally undesirable according to national and international standards. More specifically, child labour comprises all children engaged in hazardous work, all children engaged in worst forms of child labour other than hazardous work, and employment below the minimum working age, excluding, where applicable, light work performed by children over the age of 13. For further information, see the SDG Indicators Metadata Repository.
-
Март 2019Источник: International Labour OrganizationЗагружен: KnoemaДата обращения к источнику: 25 марта, 2019ВыбратьThis indicator conveys the share of the population effectively covered by a social protection system, including social protection floors. It also provides the coverage rates of the main components of social protection: child and maternity benefits, support for persons without a job, persons with disabilities, victims of work injuries and older persons. For further information, see the SDG Indicators Metadata Repository.
-
Май 2019Источник: International Labour OrganizationЗагружен: KnoemaДата обращения к источнику: 21 мая, 2019ВыбратьDescription not available
-
Сентябрь 2014Источник: International Labour OrganizationЗагружен: KnoemaДата обращения к источнику: 31 августа, 2018ВыбратьDescription not available
-
Май 2019Источник: International Labour OrganizationЗагружен: KnoemaДата обращения к источнику: 21 мая, 2019ВыбратьDescription not available
-
Май 2019Источник: International Labour OrganizationЗагружен: KnoemaДата обращения к источнику: 21 мая, 2019ВыбратьDescription not available
-
Октябрь 2018Источник: International Labour OrganizationЗагружен: KnoemaДата обращения к источнику: 16 октября, 2018ВыбратьDescription not available
-
Октябрь 2018Источник: International Labour OrganizationЗагружен: KnoemaДата обращения к источнику: 16 октября, 2018ВыбратьDescription not available
-
Май 2019Источник: International Labour OrganizationЗагружен: KnoemaДата обращения к источнику: 21 мая, 2019ВыбратьDescription not available
-
Сентябрь 2018Источник: International Labour OrganizationЗагружен: KnoemaДата обращения к источнику: 12 сентября, 2018ВыбратьDescription not available
-
Май 2019Источник: International Labour OrganizationЗагружен: KnoemaДата обращения к источнику: 21 мая, 2019ВыбратьDescription not available
-
Public social protection expenditure on benefits for the working-age as a percent of GDP in function of general social assistance (%)Сентябрь 2014Источник: International Labour OrganizationЗагружен: KnoemaДата обращения к источнику: 31 августа, 2018ВыбратьDescription not available
-
Май 2019Источник: International Labour OrganizationЗагружен: KnoemaДата обращения к источнику: 21 мая, 2019ВыбратьDescription not available
- Q
-
Январь 2019Источник: Quality of Government InstituteЗагружен: KnoemaДата обращения к источнику: 01 февраля, 2019ВыбратьData cited at: The Quality of Government Institute; Teorell, Jan, Stefan Dahlberg, Sören Holmberg, Bo Rothstein, Natalia Alvarado Pachon & Richard Svensson. 2018. The Quality of Government Standard Dataset, version Jan18. University of Gothenburg: The Quality of Government Institute, http://www.qog.pol.gu.se doi:10.18157/QoGStdJan18 In the QoG Standard TS dataset, data from 1946 to 2018 is included and the unit of analysis is country-year (e.g. Sweden-1946, Sweden-1947 and so on).
-
Декабрь 2013Источник: United Nations World Food ProgrammeЗагружен: KnoemaДата обращения к источнику: 03 октября, 2017ВыбратьQuantity Reporting: Measure food aid deliveries in metric tons
-
Май 2019Источник: World BankЗагружен: KnoemaДата обращения к источнику: 08 мая, 2019ВыбратьData cited at: The World Bank https://datacatalog.worldbank.org/ Topic:Quarterly External Debt Statistics GDDS Publication: https://datacatalog.worldbank.org/dataset/quarterly-external-debt-statistics-gdds License: http://creativecommons.org/licenses/by/4.0/ The World Bank launched the new Quarterly External Debt Statistics (QEDS) GDDS database. This database is consistent with the classifications and definitions of the 2013 External Debt Statistics: Guide for Compilers and Users (2013 EDS Guide) and Sixth Edition of Balance of Payments and International Investment Position Manual (BPM6). The QEDS GDDS database provides external debt data, starting from 2002Q4, for an extension of countries that participate in the IMF's General Data Dissemination System (GDDS).
- R
-
Reconstruction and Projection of Populations by Age, Sex and Level of Educational Attainment, 1970-2050Март 2010Источник: International Institute for Applied Systems AnalysisЗагружен: KnoemaДата обращения к источнику: 31 октября, 2013ВыбратьUsing demographic multi-state, cohort-component methods, projections for 120 countries (covering 93% of the world population in 2005) by five-year age groups, sex, and four levels of educational attainment for the years 2005-2050 are produced. Taking into account differentials in fertility and mortality by education level, the first systematic global educational attainment projections according to four widely differing education scenarios are presented. The results show the possible range of future educational attainment trends around the world, thereby contributing to long-term economic and social planning at the national and international levels, and to the assessment of the feasibility of international education goals. Samir KC et al., Projection of populations by level of educational attainment, age, and sex for 120 countries for 2005-2050, Demographic Research, 22(15), P. 383-472, 16 March 2010: http://www.demographic-research.org/Volumes/Vol22/15/.
-
Май 2019Источник: ClinicalTrials.govЗагружен: KnoemaДата обращения к источнику: 29 мая, 2019ВыбратьRegistered studies by ClinicalTrials.gov, As of May 28, 2019
-
Август 2012Источник: Multiple SourcesЗагружен: Carpe FactoВыбратьSpread of religions across the World, by country
-
Октябрь 2018Источник: International Renewable Energy AgencyЗагружен: KnoemaДата обращения к источнику: 05 апреля, 2019ВыбратьWorld : Renewable Electricity Capacity and Generation Statistics
-
Июль 2018Источник: International Renewable Energy AgencyЗагружен: KnoemaДата обращения к источнику: 04 октября, 2018ВыбратьThe Renewable Energy Statistics 2018 shows data sets on renewable power-generation capacity for 2008-2017, renewable power generation for 2008-2016 and renewable energy balances for about 120 countries and areas for 2015 and 2016. The renewable power capacity data shown in these tables represents the maximum net generating capacity of power plants and other installations that use renewable energy sources to produce electricity. For most countries and technologies, the data reflects the capacity installed and connected at the end of the calendar year. Pumped storage is included in hydropower but excluded from total renewable energy. The capacity data are presented in megawatts (MW), while the generation data are presented in gigawatt-hours (GWh). Data has been obtained from a variety of sources, including an IRENA questionnaire, official national statistics, industry association reports, consultant reports and news articles. The investment data is presented in millions of United States dollars (USD million) at current prices.
-
Февраль 2019Источник: UNESCO Institute for StatisticsЗагружен: KnoemaДата обращения к источнику: 02 мая, 2019Выбрать
-
Февраль 2019Источник: Reserve Bank of AustraliaЗагружен: KnoemaДата обращения к источнику: 24 марта, 2019ВыбратьReserve Bank of Australia Assets and Liabilities
-
Февраль 2019Источник: National Institute of Statistics, ItalyЗагружен: KnoemaДата обращения к источнику: 01 марта, 2019ВыбратьData source(s) used: Migration and calculation of foreign resident population and structure by citizenship The survey allows the calculation of the demographic balance of the foreign resident population and gives the amount of foreign residents for each year. Foreign resident population is represented by individuals who do not have Italian citizenship having usual residence in Italy. It is calculated for each municipality on December 31st of each year that follows the population Census, adding to the foreign population enumerated by the census the foreign population inflows and outflows recorded during each calendar year Other data characteristics: Data subject to change for reconstruction after the last Population census
-
Сентябрь 2018Источник: Food and Agriculture OrganizationЗагружен: KnoemaДата обращения к источнику: 07 декабря, 2018ВыбратьData on agricultural land-use are valuable for conducting studies on a various perspectives concerning agricultural production, food security and for deriving cropping intensity among others uses. Indicators derived from the land-use categories can also elucidate the environmental sustainability of countries’ agricultural practices. FAOSTAT Land-use statistics contain a wide range of information on variables that are significant for: understanding the structure of a country’s agricultural sector; making economic plans and policies for food security; deriving environmental indicators, including those related to investment in agriculture and data on gross crop area and net crop area which are useful for policy formulation and monitoring. Land-use resources sub-domain covers: Country area (including area under inland water bodies), Land area (excluding area under inland water bodies), Agricultural area, Arable land and Permanent crops, Arable land, Permanent crops, Permanent meadows and pastures, Forest area, Other land and Area equipped for irrigation. Detailed information on sub-categories: Temporary crops, Temporary meadows and pastures, Fallow land (temporary: less than 5 years), Permanent meadows and pastures cultivated and naturally grown and Organic land. Data are available from 1961 to 2009 for more than 200 countries and areas. Forest area: Global Forest Resource Assessment 2010 (FRA 2010) is the main source of forest area data in FAOSTAT. Data were provided by countries for years 1990, 2000, 2005 and 2010. Data for intermediate years were estimated for FAO using linear interpolation and tabulation. Some of the most interesting data for economists is found in this domain. The national distribution of land, among arable land, pastures and other lands, as well as the importance of irrigation are just some of the interesting data sets.
-
Декабрь 2018Источник: Food and Agriculture OrganizationЗагружен: KnoemaДата обращения к источнику: 27 мая, 2019ВыбратьThe Pesticides Use database includes data on the use of major pesticide groups (Insecticides, Herbicides, Fungicides, Plant growth regulators and Rodenticides) and of relevant chemical families. Data report the quantities (in tonnes of active ingredients) of pesticides used in or sold to the agricultural sector for crops and seeds. Information on quantities applied to single crops is not available.
-
Февраль 2018Источник: Food and Agriculture OrganizationЗагружен: KnoemaДата обращения к источнику: 22 марта, 2019ВыбратьGreenhouse gas (GHG) emissions from rice cultivation consist of methane gas from the anaerobic decomposition of organic matter in paddy fields. The FAOSTAT emissions database is computed following Tier 1 IPCC 2006 Guidelines for National GHG Inventories (http://www.ipcc-nggip.iges.or.jp/public/2006gl/vol4.html) and the IPCC 2000 Good Practice Guidance and Uncertainty Management in National GHG Inventories (http://www.ipcc-nggip.iges.or.jp/public/gp/english/). GHG emissions are provided by country, regions and special groups, with global coverage, relative to the period 1961-present (with annual updates) and with projections for 2030 and 2050, expressed both as Gg CH4 and Gg CO2eq. Implied emission factor for CH4 and activity data are also provided.
-
Февраль 2019Источник: Global Finance MagazineЗагружен: KnoemaДата обращения к источнику: 02 апреля, 2019Выбрать
- S
-
Март 2018Источник: U.S. Department of Commerce, Bureau of Economic AnalysisЗагружен: KnoemaДата обращения к источнику: 04 апреля, 2018ВыбратьFull Name: Activities of U.S. Multinational Enterprises (MNEs), Selected Data for Foreign Affiliates in All Countries in Which Investment Was Reported
-
Selected Data for Majority-Owned Foreign Affiliates in All Countries in which Investment was ReportedАвгуст 2018Источник: U.S. Department of Commerce, Bureau of Economic AnalysisЗагружен: KnoemaДата обращения к источнику: 05 октября, 2018ВыбратьFull Name: Activities of U.S. Multinational Enterprises (MNEs), Selected Data for Majority-Owned Foreign Affiliates in All Countries in which Investment was Reported.
-
Июль 2018Источник: United Nations Conference on Trade and DevelopmentЗагружен: KnoemaДата обращения к источнику: 07 августа, 2018ВыбратьThis table presents annual statistics on international trade in services of individual economies by trading partner and by 78 selected service categories. In addition, the table contains data for services trade of various groups of economies with world" and for selected principal service categories. The data presented are the result of the common work of UNCTAD, World Trade Organization (WTO) and International Trade Center (ITC). The figures are shown in four different measures:millions of United States dollarspercentages of the world totalannual percentage changes (growth rates)shares of each service category in total services. Sources: UNCTAD, WTO and ITC secretariats’ calculations, based on:IMF, Balance of Payments StatisticsEurostat, online databaseOECD, OECD.StatUN DESA Statistics Division, UN Service Trade Statistical DatabaseOther international and national sourcesUNCTAD-WTO estimates.
-
Services (BPM6): Exports and imports of total services, value, shares, and growth, annual, 2005-2017Июль 2018Источник: United Nations Conference on Trade and DevelopmentЗагружен: KnoemaДата обращения к источнику: 10 августа, 2018ВыбратьThis table presents annual statistics on total international trade in services by individual country, geographical region and economic groups, expressed in millions of dollars. Percentages of the world total and the annual percentage changes are also indicated. International trade in total commercial services is included as a memo item. The data presented are the result of the common work of UNCTAD, World Trade Organization (WTO) and International Trade Center (ITC), and are published simultaneously by the three organizations.
-
Февраль 2019Источник: International Labour OrganizationЗагружен: KnoemaДата обращения к источнику: 15 февраля, 2019ВыбратьThe series is part of the ILO estimates and is harmonized to account for differences in national data and scope of coverage, collection and tabulation methodologies as well as for other country-specific factors. For more information, refer to the ILO estimates and projections methodological note.
-
Май 2019Источник: International Labour OrganizationЗагружен: KnoemaДата обращения к источнику: 21 мая, 2019ВыбратьThe unemployed comprise all persons of working age who are without work, available for work, and looking for work, unless otherwise stated. This indicator presents the number of unemployed with an advanced level of education (tertiary education) as a percent of the unemployed population.
-
Май 2019Источник: International Labour OrganizationЗагружен: KnoemaДата обращения к источнику: 21 мая, 2019ВыбратьData provided refers to the unemployed persons whose level of education is primary or lower-secondary as a percent of the labour force with the same education level.
-
Май 2019Источник: International Labour OrganizationЗагружен: KnoemaДата обращения к источнику: 21 мая, 2019ВыбратьThe unemployed comprise all persons of working age who are without work, available for work, and looking for work, unless otherwise stated. This indicator presents the number of unemployed with an intermediate level of education (upper-secondary or post-secondary non-tertiary education) as a percent of the unemployed population.
-
Сентябрь 2018Источник: International Labour OrganizationЗагружен: KnoemaДата обращения к источнику: 12 сентября, 2018ВыбратьDescription not available
-
Share of unemployed receiving regular periodic social security unemployment benefits by schemes and sex (%)Сентябрь 2014Источник: International Labour OrganizationЗагружен: KnoemaДата обращения к источнику: 31 августа, 2018ВыбратьDescription not available
-
Май 2019Источник: Stockholm International Peace Research InstituteЗагружен: KnoemaДата обращения к источнику: 14 мая, 2019Выбрать'Information from the Stockholm International Peace Research Institute (SIPRI), https://www.sipri.org/databases/milex' The SIPRI Military Expenditure Database contains consistent time series on the military spending of countries for the period 1949–2018. The database is updated annually, which may include updates to data for any of the years included in the database. Military expenditure in local currency at current prices is presented according to both the financial year of each country and according to calendar year, calculated on the assumption that, where financial years do not correspond to calendar years, spending is distributed evenly through the year. Figures in constant (2017) and current US $, as a share of GDP and per capita are presented according to calendar year. Figures as a share of government expenditure are presented according to financial year. The availability of data varies considerably by country, but for a majority of countries that were independent at the time, data is available from at least the late 1950s. Estimates for regional military expenditure have been extended backwards depending on availability of data for countries in the region, but no estimates for total world military expenditure are available before 1988 due to the lack of data for the Soviet Union.
-
Июль 2017Источник: Johannes Kepler UniversityЗагружен: KnoemaДата обращения к источнику: 12 марта, 2019ВыбратьData cited at: Shadow Economies around the World: New Results for 158 Countries over 1991-2015 by Friedrisch SCHNEIDER. Working Paper No. 1710 July 2017 Abstract: This paper is a first attempt to estimate the size and development of the shadow economy of 158 countries over the period 1991 up to 2015. Using the Multiple Indicators, Multiple Causes (MIMIC) method we apply for the first time (i) the light intensity approach instead of GDP avoiding the problem that quite often GDP is used as a cause and indicator variable, (ii) the Predictive Mean Matching (PMM) method, and (iii) a variety of robustness tests. Results suggest that the average size of the shadow economy of these 158 countries over 1991-2015 is 32.5% of official GDP, which was 34.82% in 1991 and decreased to 30.66% in 2015. The lowest size of the shadow economy East Asian countries with 16.77% averaged over the period 1991- 2015, then follows OECD countries with 18.7% and the highest value have Latin American and sub-Saharan African countries with values above 35%.
-
Сентябрь 2014Источник: International Labour OrganizationЗагружен: KnoemaДата обращения к источнику: 31 августа, 2018ВыбратьDescription not available
-
Апрель 2019Источник: Organisation for Economic Co-operation and DevelopmentЗагружен: KnoemaДата обращения к источнику: 12 апреля, 2019ВыбратьThe SIGI is built on 21 innovative variables of discriminatory social institutions, which are grouped into 5 sub-indices: Discriminatory Family Code, Restricted Physical Integrity, Son Bias, Restricted Civil Liberties and Restricted Resources and Assets. Each of the SIGI variables is coded between 0, meaning no or very low discrimination, and 1, indicating very high discrimination.
-
Апрель 2019Источник: Organisation for Economic Co-operation and DevelopmentЗагружен: KnoemaДата обращения к источнику: 12 апреля, 2019ВыбратьThe SIGI is built on 27 innovative variables measuring discriminatory social institutions, which are grouped into 4 dimensions: discrimination in the family, restricted physical integrity, restricted access to productive and financial resources, and restricted civil liberties.Lower values indicate lower levels of discrimination in social institutions: the SIGI ranges from 0% for no discrimination to 100% for very high discrimination.
-
Август 2018Источник: Social Progress ImperativeЗагружен: KnoemaДата обращения к источнику: 21 ноября, 2018ВыбратьThe Social Progress Index is a new way to define the success of our societies. It is a comprehensive measure of real quality of life, independent of economic indicators. The Social Progress Index is designed to complement, rather than replace, economic measures such as GDP. Each year, Social Progress Imperative conducts a comprehensive review of all indicators included in the Social Progress Index framework to check data updates (which frequently include retroactive revisions) and whether new indicators have been published that are well-suited to describing social progress concepts. Such a review necessitates a recalculation of previously published versions of the Social Progress Index, as any removal or additions of indicators to the framework or changes due to retroactive revisions in data from the original data sources prevent comparability between previously published versions of the Social Progress Index and the 2018 Social Progress Index. Therefore, using the 2018 Social Progress Index framework and methodology, we provide comparable historical data for four additional years of the Social Progress Index, from 2014 to 2017. To read more about our methodology, please see the 2018 Methodology here https://www.socialprogress.org/index/methodology
-
Февраль 2018Источник: African Development Bank GroupЗагружен: KnoemaДата обращения к источнику: 24 октября, 2018ВыбратьData cited at: https://dataportal.opendataforafrica.org/bbkawjf
-
Staff access deficit by rural / urban areas (% of population not covered due to health professional staff deficit) (%)Август 2018Источник: International Labour OrganizationЗагружен: KnoemaДата обращения к источнику: 31 августа, 2018ВыбратьThis indicator is a proxy for the availability of health care. It represents the percentage of the population without access to health care due to the absence of the health workforce. The threshold for having a sufficient health workforce is 41.1 health workers per 10 000 population. A higher figure indicates worse availability. Note that this indicator reflects the supply side of availability, in this case the availability of human resources is at a level that guarantees at least basic, but universal, access. To estimate access to the services of skilled medical professionals (physicians, nursing and midwifery personnel), it uses as a proxy the relative difference between the density of these health workers in a given country (number per 10 000 population) and its median value in countries with a low level of vulnerability (defined according to the structure of employment and levels of poverty).To establish whether a country is spending 'enough' or has 'enough' key health workers, it is necessary first to define what constitutes 'enough', i.e. set a threshold against which a country's performance can be compared. Opinions differ on what constitutes 'enough' in these contexts, not least because it is likely to be a moving target, influenced by prevailing health issues, demography etc. The ILO's approach for measuring financial deficit is to: (i) calculate the median expenditure on health (excluding OOP) in low-vulnerability countries, then (ii) for each country, compare spending against this median. In 2014, the median in low-vulnerability countries was US$239. For example, a country spending 50% less than the median in low-vulnerability countries has a financial deficit of 50%. The same principle applies to the staff access deficit indicator, for which the 2014 median in low-vulnerability countries was 41.1. This is one of five indicators measuring key dimensions of deficits in health care access and coverage. For analytical purposes the full set of indicators should be considered together.
-
Август 2016Источник: Actionable Governance Indicators Data PortalЗагружен: KnoemaДата обращения к источнику: 30 августа, 2016ВыбратьStatistical Capacity Indicator has three dimensions: a). Statistical Methodology b). Source data and c). Periodicity and timeliness. For each dimension, a country is scored against specific criteria, using information available from the World Bank, IMF, UN, UNESCO, and WHO. A composite score for each dimension is calculated by adding criteria scores, ranges from 0 to 1, and multiplying by 10. And an overall score combining all three dimensions are derived for each country on a scale of 0-100 by taking average of these three dimensions. A score of 100 indicates that the country meets all the criteria. The first dimension, statistical methodology, Countries are evaluated against a set of criteria such as use of an updated national accounts base year, use of the latest BOP manual, external debt reporting status, subscription to IMF’s Special Data Dissemination Standard, and enrolment data reporting to UNESCO. The second dimension, source data, reflects whether a country conducts data collection activities in line with internationally recommended periodicity, and whether data from administrative systems are available and reliable for statistical estimation purposes. Specifically, the criteria used are the periodicity of population and agricultural censuses, the periodicity of poverty and health related surveys, and completeness of vital registration system coverage. The third dimension, periodicity and timeliness, looks at the availability and periodicity of key socioeconomic indicators, of which nine are MDG indicators. This dimension attempts to measure the extent to which data are made accessible to users through transformation of source data into timely statistical outputs. Criteria used include indicators on income poverty, child and maternal health, HIV/AIDS, primary completion, gender equality, access to water and GDP growth.
-
Август 2013Источник: Robert S. Strauss Center for International Security and LawЗагружен: KnoemaДата обращения к источнику: 02 февраля, 2016ВыбратьThis dataset provides data on literacy rates, primary and secondary school attendance rates access to improved water and sanitation, household access to electricity, and household ownership of radio and television. Unlike other datasets, notably the World Bank’s World Development Indicators (WDI), this dataset provides data at the subnational level, specifically the first administrative district level. Furthermore, the data is comparable both within and across countries. This subnational level of data allows for assessment of education and household characteristics at a more relevant level for allocation of resources and targeting development interventions.
-
Апрель 2019Источник: International Monetary FundЗагружен: KnoemaДата обращения к источнику: 15 мая, 2019ВыбратьThe economic recovery in sub-Saharan Africa continues. Regional growth is set to pick up from 3 percent in 2018 to 3.5 percent in 2019, before stabilizing at close to 4 percent over the medium term. These region wide numbers mask considerable differences in the growth performance and prospects of countries across the region. About half of the region’s countries— mostly non-resource-intensive countries—are expected to grow at 5 percent or more, which would see per capita incomes rise faster than the rest of the world on average over the medium term. For all other countries, mostly resource-intensive countries, improvements in living standards will be slower. Notwithstanding these different economic prospects and policy priorities, countries share the challenge of strengthening resilience and creating higher, more inclusive and durable growth. Addressing these challenges requires building fiscal space and enhancing resilience to shocks by stepping up actions to mobilize revenues, alongside policies to boost productivity and private investment
-
Февраль 2015Источник: World Life ExpectancyЗагружен: KnoemaДата обращения к источнику: 07 мая, 2015Выбрать
-
Апрель 2018Источник: U.S. Agency for International DevelopmentЗагружен: KnoemaДата обращения к источнику: 13 июля, 2018ВыбратьThese tables offer a summary of obligations and disbursements in current and constant dollars by funding agency, funding account, and country from 2001 to the most recent year.
-
Апрель 2018Источник: U.S. Agency for International DevelopmentЗагружен: KnoemaДата обращения к источнику: 13 июля, 2018ВыбратьThese tables offer a summary of obligations and disbursements in current and constant dollars by implementing agency and country from 2001 to the most recent year.
-
Апрель 2018Источник: U.S. Agency for International DevelopmentЗагружен: KnoemaДата обращения к источнику: 13 июля, 2018ВыбратьThese tables offer a summary of obligations and disbursements in current and constant dollars by country from 1946 to the most recent year.
-
Апрель 2018Источник: U.S. Agency for International DevelopmentЗагружен: KnoemaДата обращения к источнику: 13 июля, 2018ВыбратьThese tables offer a summary of obligations and disbursements in current and constant dollars by U.S. Government (USG) sector and country from 2001 to the most recent year.
-
Апрель 2019Источник: Organisation for Economic Co-operation and DevelopmentЗагружен: KnoemaДата обращения к источнику: 12 апреля, 2019Выбрать
-
Май 2018Источник: Suriname Tourism FoundationЗагружен: KnoemaДата обращения к источнику: 03 июля, 2018ВыбратьLocation:-Visitors are coming from mentioned location.(World is total of all visitors) Nationality:-Nationality of visitors, whether the nationality of the visitors is same as the location or they belong to different nationality.(Under this dimension "Total" represents total number of visitors by their nationality) Ports:-Tourist arrival via ports.
-
Февраль 2019Источник: Fraser InstituteЗагружен: KnoemaДата обращения к источнику: 08 мая, 2019ВыбратьData cited at: "Annual Survey of Mining Companies: 2016"@Fraser Institute The Fraser Institute Annual Survey of Mining Companies was sent to approximately 4,100 exploration, development, and other mining-related companies around the world. Several mining publications and associations also helped publicize the survey. The survey, conducted from October 9, 2012, to January 6, 2013, represents responses from 742 of those companies. The companies participating in the survey reported exploration spending of US$6.2 billion in 2012 and US$ 5.4 billion in 2011.
-
Июнь 2018Источник: Organisation for Economic Co-operation and DevelopmentЗагружен: KnoemaДата обращения к источнику: 04 июня, 2018Выбрать
-
Декабрь 2018Источник: Organisation for Economic Co-operation and DevelopmentЗагружен: KnoemaДата обращения к источнику: 03 декабря, 2018ВыбратьSurvey on Monitoring the Paris Declaration. The dataset contains data as reported by donors and national co-ordinators in participating partner countries. The dataset includes all quantitative data collected through the 2006, 2008 and 2011 Surveys.
-
Июль 2018Источник: Sustainable Development Solutions NetworkЗагружен: KnoemaДата обращения к источнику: 10 августа, 2018ВыбратьThe 2018 SDG Index and Dashboards report presents a revised and updated assessment of countries’ distance to achieving the Sustainable Development Goals (SDGs). It includes detailed SDG Dashboards to help identify implementation priorities for the SDGs. The report also provides a ranking of countries by the aggregate SDG Index of overall performance.
-
Ноябрь 2018Источник: Institute for Health Metrics and EvaluationЗагружен: KnoemaДата обращения к источнику: 30 ноября, 2018ВыбратьThe Global Burden of Disease Study 2017 (GBD 2017), coordinated by the Institute for Health Metrics and Evaluation (IHME), estimated the burden of diseases, injuries, and risk factors from 1990 to 2017. The United Nations established, in September 2015, the Sustainable Development Goals (SDGs), which specify 17 universal goals, 169 targets, and 232 indicators leading up to 2030. Drawing from GBD 2017, this dataset provides estimates on progress for 41 health-related SDG indicators for 195 countries and territories from 1990 to 2017, and projections, based on past trends, for 2018 to 2030. Estimates are also included for the health-related SDG index, a summary measure of overall performance across the health-related SDGs.
-
Ноябрь 2018Источник: United Nations Statistics DivisionЗагружен: KnoemaДата обращения к источнику: 10 декабря, 2018ВыбратьThe Sustainable Development Goals Report 2018 reviews progress in the third year of implementation of the 2030 Agenda presenting an overview with charts and info-graphics of highlights of the 17 Goals, followed by chapters that focus in more depth on the Goals under review at the high-level political forum in July 2018. This report follows the recently published report of the United Nations Secretary-General on "Progress towards the Sustainable Development Goals" (E/2018/64), both of which are based on the global indicator framework developed by the Inter-Agency and Expert Group on SDG Indicators (IAEG-SDGs) and agreed by the General Assembly in July 2017 in resolution 71/313. The launch of The Sustainable Development Goals Report 2018 is accompanied by the Global SDG Indicators Database, which presents country level data and global and regional aggregates compiled through the UN System and other international organizations.
-
Февраль 2012Источник: International Monetary FundЗагружен: KnoemaВыбратьThis database covers the universe of systemic banking crises for the period 1970-2009, and also includes data on the resolution and fiscal and economic costs of banking crises. Note: Laeven, Luc and Fabian Valencia, 2010, Resolution of Banking Crises: The Good, the Bad, and the Ugly, IMF working paper 10/146.
- T
-
Апрель 2019Источник: Organisation for Economic Co-operation and DevelopmentЗагружен: KnoemaДата обращения к источнику: 12 апреля, 2019Выбрать
-
Апрель 2019Источник: Organisation for Economic Co-operation and DevelopmentЗагружен: KnoemaДата обращения к источнику: 12 апреля, 2019Выбрать
-
Апрель 2019Источник: Organisation for Economic Co-operation and DevelopmentЗагружен: KnoemaДата обращения к источнику: 12 апреля, 2019Выбрать
-
Апрель 2019Источник: Organisation for Economic Co-operation and DevelopmentЗагружен: KnoemaДата обращения к источнику: 12 апреля, 2019Выбрать
-
Сентябрь 2018Источник: National Bureau of Economic ResearchЗагружен: KnoemaДата обращения к источнику: 15 января, 2019ВыбратьThe Chinn-Ito index (KAOPEN) is an index measuring a country's degree of capital account openness. The index was initially introduced in Chinn and Ito (Journal of Development Economics, 2006). KAOPEN is based on the binary dummy variables that codify the tabulation of restrictions on cross-border financial transactions reported in the IMF's Annual Report on Exchange Arrangements and Exchange Restrictions (AREAER). Chinn, Menzie D. and Hiro Ito (2008). "A New Measure of Financial Openness". Journal of Comparative Policy Analysis, Volume 10, Issue 3, p. 309 – 322 (September). Ito, Hiro (2006). "Financial Development in Asia: Thresholds, Institutions, and the Sequence of Liberalization". North American Journal of Economics and Finance, issue 17(3) (December). Chinn, Menzie D. and Hiro Ito (2006)."What Matters for Financial Development? Capital Controls, Institutions, and Interactions," Journal of Development Economics, Volume 81, Issue 1, Pages 163-192 (October). The longer version is available as NBER Working Paper No. 11370 (May 2005). The previous version is "Capital Account Liberalization, Institutions and Financial Development: Cross Country Evidence," (with Menzie Chinn) NBER Working Paper Series, #8967 (June 2002).
-
Ноябрь 2015Источник: Save the Children FederationЗагружен: KnoemaДата обращения к источнику: 07 декабря, 2015Выбрать
-
Январь 2019Источник: International Finance and Macroeconomics (IFM) Milken InstituteЗагружен: KnoemaДата обращения к источнику: 11 февраля, 2019ВыбратьThe Global Opportunity Index (GOI) answers a pressing need for information that's vital to a thriving global economy like what policies can governments pursue to attract foreign direct investment (FDI), expand their economies, and accelerate job creation, everything multinational companies, other investors, and development agencies need to know before making large-scale, long-term capital commitments. Methodology The GOI considers economic and financial factors that influence investment activities as well as key business, legal and regulatory policies that governments can modify to support and often drive investments. Overall, it tracks countries’ performance on more than 50 variables aggregated in five categories, each measuring an aspect of a country’s attractiveness for investors: (1) its economic performance; (2) the ability for investors to access financial services; (3) the cost of doing business; (4) the level of support its institutions provide to businesses; and (5) the extent to which its institutions, policies, and legal system facilitate international integration.
-
Июнь 2018Источник: Walk Free FoundationЗагружен: KnoemaДата обращения к источнику: 23 июля, 2018ВыбратьThe Global Slavery Index, the flagship report of the Walk Free Foundation. The Global Slavery Index estimates the number of people in modern slavery in 167 countries. It is a tool for citizens, non government organisations, businesses and public officials to understand the size of the problem, existing responses and contributing factors, so they can build sound policies that will end modern slavery. The Global Slavery Index answers the following questions: What is the estimated prevalence of modern slavery country by country, and what is the absolute number by population? How are governments tackling modern slavery? What factors explain or predict the prevalence of modern slavery? Government Response Rating by Country A - 70 to 79.9 BBB - 60 to 69.9 BB - 50 to 59.9 B - 40 to 49.9 CCC - 30 to 39.9 CC - 20 to 29.9 C - 10 to 19.9 D - <0 to 9.9
-
Март 2013Источник: United Nations Statistics DivisionЗагружен: KnoemaДата обращения к источнику: 03 марта, 2014ВыбратьThe CDS (the Common Data Set) is a joint effort by Eurostat, OECD, UNSD, UNCTAD and WTO to reconcile their time series on merchandise trade statistics, using international standards as a benchmark. Each agency is in charge of supplying figures for a predefined set of reporting economies (see Data Providing Agencies and Sources). Reconciliations, co-ordinated by WTO, consist of scrutinising significant differences between the agencies' data to determine the best value. In many instances, this results in finding an agreement on substitution values and estimates. Thus, the CDS database gives access to statistics and documentation of both officially reported and reconciled series. It covers annual total merchandise export and import values of over 200 economies for the period 1995 to 2011.
-
Август 2018Источник: International Benchmarking Network for Water and Sanitation UtilitiesЗагружен: KnoemaДата обращения к источнику: 05 сентября, 2018Выбрать
-
Февраль 2015Источник: University of KeeleЗагружен: KnoemaДата обращения к источнику: 24 апреля, 2015ВыбратьThis water poverty index is a first pass at trying to establish an international measure comparing performance in the water sector across countries in a holistic way that brings in the diverse aspects and issues that are relevant. It does seem to give some sensible results but it does not pretend to be definitive nor offer a totally accurate measure of the situation.
-
Июнь 2018Источник: World Inequality DatabaseЗагружен: KnoemaДата обращения к источнику: 08 июня, 2018ВыбратьThe World Inequality Report 2018 relies on a cutting-edge methodology to measure income and wealth inequality in a systematic and transparent manner. By developing this report, the World Inequality Lab seeks to fill a democratic gap and to equip various actors of society with the necessary facts to engage in informed public debates on inequality. Table: MacroData: Which contains macro data series (aggregate and total income and wealth variables, as well as population variables and other macro indicator such as deflators, exchange rates, etc.) Inequality Data: Which contains inequality data series (income and wealth shares, thresholds, averages for different percentiles of the population).
-
Декабрь 2015Источник: United Nations Statistics DivisionЗагружен: KnoemaДата обращения к источнику: 19 августа, 2017ВыбратьData cited at: United Nations Statistics Division https://unstats.un.org/home/ Publication: https://unstats.un.org/unsd/gender/worldswomen.html License: https://creativecommons.org/licenses/by-nc/4.0/ The World’s Women 2015 comprises eight chapters covering critical areas of policy concern: population and families, health, education, work, power and decision-making, violence against women, environment, and poverty. In each area, a life-cycle approach is introduced to reveal the experiences of women and men during different periods of life—from childhood and the formative years, through the working and reproductive stages, to older ages. The statistics and analyses presented in the following pages are based on a comprehensive and careful assessment of a large set of available data from international and national statistical agencies. Each chapter provides an assessment of gaps in gender statistics, highlighting progress in the availability of statistics, new and emerging methodological developments, and areas demanding further attention from the international community
-
Февраль 2019Источник: World Integrated Trade SolutionЗагружен: KnoemaДата обращения к источнику: 07 марта, 2019ВыбратьThis dataset provides trade and tariff data for countries where the reporter is "World".
-
Май 2019Источник: International Labour OrganizationЗагружен: KnoemaДата обращения к источнику: 21 мая, 2019ВыбратьDescription not available
-
Сентябрь 2014Источник: International Labour OrganizationЗагружен: KnoemaДата обращения к источнику: 31 августа, 2018ВыбратьDescription not available
-
Октябрь 2014Источник: United Nations Conference on Trade and DevelopmentЗагружен: KnoemaДата обращения к источнику: 03 ноября, 2014ВыбратьEstimates and forecasts on labour force data: (1) Total labour force and female labour force, expressed in thousands (2) Total agriculture labour force and female labour force, expressed in thousands.
-
Сентябрь 2018Источник: Organisation for Economic Co-operation and DevelopmentЗагружен: KnoemaДата обращения к источнику: 26 сентября, 2018ВыбратьOfficial Development Financing (ODF), measured for recipient countries only, is defined as the sum of their receipts of bilateral ODA, concessional and non-concessional resources from multilateral sources, and bilateral other official flows made available for reasons unrelated to trade, in particular loans to refinance debt.
-
Май 2019Источник: Organisation for Economic Co-operation and DevelopmentЗагружен: KnoemaДата обращения к источнику: 28 мая, 2019ВыбратьTotal Official Flows: the sum of Official Development Assistance (ODA) and Other Official Flows (OOF) represents the total (gross or net) disbursements by the official sector at large to the recipient country shown.
-
Май 2019Источник: Organisation for Economic Co-operation and DevelopmentЗагружен: KnoemaДата обращения к источнику: 28 мая, 2019ВыбратьTotal Receipts, Net: in addition to Official Development Assistance, this heading includes in particular: other official bilateral transactions which are not concessional or which, even though they have concessional elements, are primarily trade facilitating in character (i.e., "Other Official Flows''); changes in bilateral long-term assets of the private non-monetary and monetary sectors, in particular guaranteed export credits, private direct investment, portfolio investment and, to the extent they are not covered in the preceding headings, loans by private banks. Flows from the multilateral sector which are not classified as concessional are also included here.
-
Сентябрь 2018Источник: National Bureau of Statistics of the Republic of MoldovaЗагружен: KnoemaДата обращения к источнику: 29 ноября, 2018ВыбратьSource: National Bureau of Statistics of the Republic of Moldova http://www.statistica.md/index.php?l=en Topic: Statbank, Regional statistics Publication: http://statbank.statistica.md/pxweb/pxweb/en/60%20Statistica%20regionala/60%20Statistica%20regionala__19%20TRA/?rxid=5360837a-13b5-4912-a2e0-12892e96d2ab License: http://creativecommons.org/licenses/by/4.0/ Tourism & Transport Statistics of Moldova, 2015
-
Октябрь 2018Источник: National Statistics Bureau, BhutanЗагружен: KnoemaДата обращения к источнику: 20 декабря, 2018Выбрать
-
Май 2017Источник: Statistics BotswanaЗагружен: KnoemaДата обращения к источнику: 31 декабря, 2018ВыбратьData cited at: https://botswana.opendataforafrica.org/stuwedg Tourism
-
Декабрь 2015Источник: National Center for Statistics and Economic Studies, Republic of CongoЗагружен: KnoemaДата обращения к источнику: 07 декабря, 2018ВыбратьData cited at: https://rcongo.opendataforafrica.org/TREOC2015 This Dataset describes the list of common indicators from Trade External Data Of Congo
-
Июнь 2018Источник: Food and Agriculture OrganizationЗагружен: KnoemaДата обращения к источнику: 22 марта, 2019Выбрать
-
Январь 2016Источник: National Institute of Statistics, MadagascarЗагружен: KnoemaДата обращения к источнику: 27 января, 2019ВыбратьData cited at: https://madagascar.opendataforafrica.org/MGTRS2016
-
Июнь 2018Источник: Pew Research CenterЗагружен: KnoemaДата обращения к источнику: 22 августа, 2018ВыбратьLevels of restrictions on religion Government Restrictions Index Very high- 6.6 to 10.0 High- 4.5 to 6.5 Moderate - 2.4 to 4.4 Low- 0.0 to 2.3 Social Hostilities Index Very high- 7.2 to 10.0 High- 3.6 to 7.1 Moderate- 1.5 to 3.5 Low- 0.0 to 1.4
-
Март 2018Источник: EurostatЗагружен: KnoemaДата обращения к источнику: 18 марта, 2018ВыбратьEurostat's database covers 1) Production and trade in roundwood and wood products, including primary and secondary products 2) Economic data on forestry and logging, including employment data 3) Sustainable forest management, comprising forest resources (assets) and environmental data. The main types of primary forest products included in (1) are: roundwood, sawnwood, wood-based panels, pulp, and paper and paperboard. Secondary products include further processed wood and paper products. These products are presented in greater detail; definitions are available. All of the data are compiled from the Joint Forest Sector Questionnaire (JFSQ), except for table (e), which is directly extracted from Eurostat's international trade database COMEXT (HS/CN Chapter 44). The tables in (1) cover details of the following topics: - Roundwood removals and production by type of wood and assortment (a) - Roundwood production by type of ownership (b) - Production and trade in roundwood, fuelwood and other basic products (c) - Trade in industrial roundwood by assortment and species (d) - Tropical wood imports to the EU from Chapter 44 of the Harmonised System (e) - Production and trade in sawnwood, panels and other primary products (f) - Sawnwood trade by species (g) - Production and trade in pulp and paper & paperboard (h) - Trade in secondary wood and paper products (i) Data in (2) include the output, intermediate consumption, gross value added, fixed capital consumption, gross fixed capital formation and different measures of income of forestry and logging. The data are in current basic prices and are compatible with National Accounts. They are collected as part of Intergrated environmental and economic accounting for forests (IEEAF), which also covers labour input in annual work units (AWU). Under (2), two separate tables cover the number of employees of forestry and logging, the manufacture of wood and products of wood and cork, and the manufacture of paper and paper products, as estimated from the Labour Force Survey results. There are two separate tables because of the change in the EU's classification of economic activities from NACE Rev. 1.1 to NACE Rev. 2 in 2008. More detailed information on wood products and accounting, including definitions and questionnaires, can be found on our open-access communication platform under the interest group 'Forestry statistics and accounts'. Data in (3) are not collected by Eurostat, but by the FAO, UNECE, Forest Euope, the European Commission's departments for Environment and the Joint Research Centre. They include forest area, wood volume, defoliation on sample plots, fires and areas with protective functions.
- U
-
Январь 2018Источник: National Science FoundationЗагружен: KnoemaДата обращения к источнику: 01 февраля, 2018Выбрать
-
Сентябрь 2018Источник: U.S. Department of Commerce, Bureau of Economic AnalysisЗагружен: KnoemaДата обращения к источнику: 21 ноября, 2018ВыбратьU.S. Direct Investment Abroad: Country and Industry Detail for Selected Items, 2017
-
Июль 2017Источник: U.S. Department of Commerce, Bureau of Economic AnalysisЗагружен: KnoemaДата обращения к источнику: 31 июля, 2017ВыбратьU.S. Direct Investment Abroad: Balance of Payments and Direct Investment Position Data
-
Июль 2018Источник: U.S. Department of Commerce, Bureau of Economic AnalysisЗагружен: KnoemaДата обращения к источнику: 31 июля, 2018Выбрать
-
Апрель 2019Источник: U.S. Department of AgricultureЗагружен: KnoemaДата обращения к источнику: 13 апреля, 2019ВыбратьThis dataset covers the following public data available at US Dept. of Agriculture website. 1. Wheat: Supply and disappearance 2. Hard red winter wheat: Supply and disappearance 3. Hard red spring wheat: Supply and disappearance 4. Soft red winter wheat: Supply and disappearance 5. White wheat: Supply and disappearance 6. U.S. wheat exports by selected destinations (1,000 metric tons) Reference Market year (start from Jun-May) Q 1 in Market year: Jun-August Q 2 in Market year: Sep-Nov Q 3 in Market year: Dec-Feb Q 4 in Market year: March-May
-
Июль 2018Источник: United Nations Public Administration Country StudiesЗагружен: KnoemaДата обращения к источнику: 13 августа, 2018Выбрать1. The EGDI is based on a comprehensive Survey of the online presence of all 193 United Nations Member States, which assesses national websites and how e-government policies and strategies are applied in general and in specific sectors for delivery of essential services. The assessment rates the e-government performance of countries relative to one another as opposed to being an absolute measurement. The results are tabulated and combined with a set of indicators embodying a country’s capacity to participate in the information society, without which e-government development efforts are of limited immediate use. Although the basic model has remained consistent, the precise meaning of these values varies from one edition of the Survey to the next as understanding of the potential of e-government changes and the underlying technology evolves. This is an important distinction because it also implies that it is a comparative framework that seeks to encompass various approaches that may evolve over time instead of advocating a linear path with an absolute goal. 2. E-Government Development Index-EGDI Very High-EGDI (Greater than 0.75) High-EGDI (Between 0.50 and 0.75) Middle-EGDI (Between 0.25 and 0.50) Low-EGDI (Less than 0.25)
-
Май 2019Источник: United Nations Statistics DivisionЗагружен: KnoemaДата обращения к источнику: 30 мая, 2019ВыбратьThe United Nations Industrial Commodity Statistics Database provides annual statistics on the production of major industrial commodities by country. Data are provided in terms of physical quantities as well as monetary value. The online database covers the years 1995 to 2013. Additional historical data is available on request, based on a different product list, for the years 1950-2003.
-
Декабрь 2018Источник: United Nations Statistics DivisionЗагружен: KnoemaДата обращения к источнику: 05 декабря, 2018ВыбратьThe Energy Statistics Database contains comprehensive energy statistics on the production, trade, conversion and final consumption of primary and secondary; conventional and non-conventional; and new and renewable sources of energy. The Energy Statistics dataset, covering the period from 1990 onwards, is available at UNdata
-
Декабрь 2015Источник: World Health OrganizationЗагружен: KnoemaДата обращения к источнику: 15 сентября, 2017Выбрать
-
Февраль 2019Источник: International Labour OrganizationЗагружен: KnoemaДата обращения к источнику: 15 февраля, 2019ВыбратьThe unemployment rate is the number of persons who are unemployed as a percent of the total number of employed and unemployed persons (i.e., the labour force). The series is part of the ILO estimates and is harmonized to account for differences in national data and scope of coverage, collection and tabulation methodologies as well as for other country-specific factors. Data for 1991-2016 are estimates while 2017-2021 data are projections. The dataset was updated as of November 2017. For more information, refer to the indicator description and the ILO estimates and projections methodological note.
-
Май 2019Источник: International Labour OrganizationЗагружен: KnoemaДата обращения к источнику: 21 мая, 2019ВыбратьThe unemployed comprise all persons of working age who were: a) without work during the reference period, i.e. were not in paid employment or self-employment; b) currently available for work, i.e. were available for paid employment or self-employment during the reference period; and c) seeking work, i.e. had taken specific steps in a specified recent period to seek paid employment or self-employment. For purposes of international comparability, the period of job search is often defined as the preceding four weeks, but this varies from country to country. The specific steps taken to seek employment may include registration at a public or private employment exchange; application to employers; checking at worksites, farms, factory gates, market or other assembly places; placing or answering newspaper advertisements; seeking assistance of friends or relatives; looking for land, building, machinery or equipment to establish own enterprise; arranging for financial resources; and applying for permits and licences.
-
Май 2019Источник: International Labour OrganizationЗагружен: KnoemaДата обращения к источнику: 21 мая, 2019ВыбратьThe unemployed comprise all persons of working age who were: a) without work during the reference period, i.e. were not in paid employment or self-employment; b) currently available for work, i.e. were available for paid employment or self-employment during the reference period; and c) seeking work, i.e. had taken specific steps in a specified recent period to seek paid employment or self-employment. For purposes of international comparability, the period of job search is often defined as the preceding four weeks, but this varies from country to country. The specific steps taken to seek employment may include registration at a public or private employment exchange; application to employers; checking at worksites, farms, factory gates, market or other assembly places; placing or answering newspaper advertisements; seeking assistance of friends or relatives; looking for land, building, machinery or equipment to establish own enterprise; arranging for financial resources; and applying for permits and licences. Data are disaggregated by category of unemployed persons according to whether (1) they have been previously employed or (2) they were seeking their first job.
-
Май 2019Источник: International Labour OrganizationЗагружен: KnoemaДата обращения к источнику: 21 мая, 2019ВыбратьThe unemployed comprise all persons of working age who were: a) without work during the reference period, i.e. were not in paid employment or self-employment; b) currently available for work, i.e. were available for paid employment or self-employment during the reference period; and c) seeking work, i.e. had taken specific steps in a specified recent period to seek paid employment or self-employment. For purposes of international comparability, the period of job search is often defined as the preceding four weeks, but this varies from country to country. The specific steps taken to seek employment may include registration at a public or private employment exchange; application to employers; checking at worksites, farms, factory gates, market or other assembly places; placing or answering newspaper advertisements; seeking assistance of friends or relatives; looking for land, building, machinery or equipment to establish own enterprise; arranging for financial resources; and applying for permits and licences. Data are disaggregated by level of education, which refers to the highest levelof education completed, classified according to the International Standard Classification of Education (ISCE).
-
Май 2019Источник: International Labour OrganizationЗагружен: KnoemaДата обращения к источнику: 21 мая, 2019ВыбратьThe unemployed comprise all persons of working age who were: a) without work during the reference period, i.e. were not in paid employment or self-employment; b) currently available for work, i.e. were available for paid employment or self-employment during the reference period; and c) seeking work, i.e. had taken specific steps in a specified recent period to seek paid employment or self-employment. For purposes of international comparability, the period of job search is often defined as the preceding four weeks, but this varies from country to country. The specific steps taken to seek employment may include registration at a public or private employment exchange; application to employers; checking at worksites, farms, factory gates, market or other assembly places; placing or answering newspaper advertisements; seeking assistance of friends or relatives; looking for land, building, machinery or equipment to establish own enterprise; arranging for financial resources; and applying for permits and licences. Data are disaggregated by the unemployed person's former economic activity according to the latest version of the International Standard Industrial Classification of All Economic Activities (ISIC) available for that year. Economic activity refers to the main activity of the establishment in which a person worked during the reference period and does not depend on the specific duties or functions of the person's job, but on the characteristics of the economic unit in which this person works.
-
Май 2019Источник: International Labour OrganizationЗагружен: KnoemaДата обращения к источнику: 21 мая, 2019ВыбратьThe unemployed comprise all persons of working age who were: a) without work during the reference period, i.e. were not in paid employment or self-employment; b) currently available for work, i.e. were available for paid employment or self-employment during the reference period; and c) seeking work, i.e. had taken specific steps in a specified recent period to seek paid employment or self-employment. For purposes of international comparability, the period of job search is often defined as the preceding four weeks, but this varies from country to country. The specific steps taken to seek employment may include registration at a public or private employment exchange; application to employers; checking at worksites, farms, factory gates, market or other assembly places; placing or answering newspaper advertisements; seeking assistance of friends or relatives; looking for land, building, machinery or equipment to establish own enterprise; arranging for financial resources; and applying for permits and licences. Data are disaggregated by the unemployed person's former occupation according to the latest version of the International Standard Classification of Occupations (ISCO) available for that year. Information on occupation provides a description of the set of tasks and duties which are carried out by, or can be assigned to, one person.
-
Февраль 2019Источник: International Labour OrganizationЗагружен: KnoemaДата обращения к источнику: 15 февраля, 2019ВыбратьThe unemployment rate is the number of persons who are unemployed as a percent of the total number of employed and unemployed persons (i.e., the labour force). The series is part of the ILO estimates and is harmonized to account for differences in national data and scope of coverage, collection and tabulation methodologies as well as for other country-specific factors. For more information, refer to the indicator description and the ILO estimates and projections methodological note.
-
Июнь 2018Источник: International Labour OrganizationЗагружен: KnoemaДата обращения к источнику: 31 августа, 2018ВыбратьThe unemployment rate is the number of persons who are unemployed as a percent of the total number of employed and unemployed persons (i.e., the labour force). The series is part of the ILO estimates and is harmonized to account for differences in national data and scope of coverage, collection and tabulation methodologies as well as for other country-specific factors. For more information, refer to the indicator description and the ILO estimates and projections methodological note. Data for 1991-2016 are estimates while 2017-2021 data are projections. The dataset was updated as of November 2017.
-
Февраль 2019Источник: International Labour OrganizationЗагружен: KnoemaДата обращения к источнику: 15 февраля, 2019Выбрать
-
Февраль 2019Источник: International Labour OrganizationЗагружен: KnoemaДата обращения к источнику: 15 февраля, 2019Выбрать
-
Февраль 2019Источник: International Labour OrganizationЗагружен: KnoemaДата обращения к источнику: 15 февраля, 2019ВыбратьThe unemployment rate is the number of persons who are unemployed as a percent of the total number of employed and unemployed persons (i.e., the labour force). The series is part of the ILO estimates and is harmonized to account for differences in national data and scope of coverage, collection and tabulation methodologies as well as for other country-specific factors. For more information, refer to the indicator description and the ILO estimates and projections methodological note.
-
Июнь 2015Источник: United Nations Environment ProgrammeЗагружен: Pallavi SДата обращения к источнику: 30 июня, 2016ВыбратьThe GEO Data Portal is the authoritative source for data sets used by UNEP and its partners in the Global Environment Outlook (GEO) report and other integrated environment assessments. The GEO Data Portal gives access to a broad socio-economic data sets from authoritative sources at global, regional, sub-regional and national levels. The contents of the Data Portal cover environmental themes such as climate, forests and freshwater and many others, as well as socioeconomic categories, including education, health, economy, population and environmental policies.
-
Сентябрь 2018Источник: United Nations Environment ProgrammeЗагружен: KnoemaДата обращения к источнику: 22 октября, 2018Выбрать
-
Февраль 2018Источник: UNESCO Institute for StatisticsЗагружен: KnoemaДата обращения к источнику: 06 июля, 2018ВыбратьThe UNESCO Institute for Statistics (UIS) is the statistical office of UNESCO and is the UN depository for global statistics in the fields of education, science and technology, culture and communication. The UIS was established in 1999. It was created to improve UNESCO’s statistical programme and to develop and deliver the timely, accurate and policy-relevant statistics needed in today’s increasingly complex and rapidly changing social, political and economic environments. The UIS is based in Montreal, Canada. The dataset contains over 1,000 types of indicators and raw data on education, literacy, science and technology, culture and communication. The UIS collects the data for more than 200 countries and territories from Member States and international organizations.
-
Июнь 2018Источник: United Nations High Commissioner for RefugeesЗагружен: KnoemaДата обращения к источнику: 16 июля, 2018ВыбратьNote: In the 2017 data, figures between 1 and 4 represent situations where the figures are being kept confidential to protect the anonymity of individuals. Such figures are not included in any totals. The UNHCR Population Statistics Database currently contains data about UNHCR's populations of concern from the year 1959 up to 2017. UNHCR identifies seven population categories, collectively referred to as ‘persons of concern’: refugees, asylum-seekers, internally displaced persons (IDPs), refugees who have returned home (returnees), IDPs who have returned home, persons under UNHCR’s statelessness mandate, and others who do not fall under these categories but to whom the agency extends protection. Since 2007, two additional sub-categories have been added: individuals in refugee-like situations (included under refugees) and those in IDP-like situations (included under IDPs). Refugees include individuals recognised under the 1951 Convention relating to the Status of Refugees; its 1967 Protocol; the 1969 OAU Convention Governing the Specific Aspects of Refugee Problems in Africa; those recognised in accordance with the UNHCR Statute; individuals granted complementary forms of protection; or those enjoying temporary protection. Since 2007, the refugee population also includes people in a refugee-like situation. Asylum-seekers are individuals who have sought international protection and whose claims for refugee status have not yet been determined, irrespective of when they may have been lodged. Internally displaced persons (IDPs) are people or groups of individuals who have been forced to leave their homes or places of habitual residence, in particular as a result of, or in order to avoid the effects of armed conflict, situations of generalised violence, violations of human rights, or natural or man-made disasters, and who have not crossed an international border. For the purposes of UNHCR's statistics, this population only includes conflict-generated IDPs to whom the Office extends protection and/or assistance. Since 2007, the IDP population also includes people in an IDP-like situation. Returned refugees are former refugees who have returned to their country of origin spontaneously or in an organised fashion but are yet to be fully integrated. Such return would normally only take place in conditions of safety and dignity. Returned IDPs refer to those IDPs who were beneficiaries of UNHCR's protection and assistance activities and who returned to their areas of origin or habitual residence during the year. Stateless persons are defined under international law as persons who are not considered as nationals by any State under the operation of its law. In other words, they do not possess the nationality of any State. UNHCR statistics refer to persons who fall under the agency’s statelessness mandate because they are stateless according to this international definition, but data from some countries may also include persons with undetermined nationality. Others of concern refers to individuals who do not necessarily fall directly into any of the groups above, but to whom UNHCR extends its protection and/or assistance services, based on humanitarian or other special grounds.
-
Февраль 2017Источник: United Nations Children's FundЗагружен: KnoemaДата обращения к источнику: 09 августа, 2017ВыбратьMaternal mortality refers to deaths due to complications from pregnancy or childbirth. From 1990 to 2015, the global maternal mortality ratio declined by 44 per cent – from 385 deaths to 216 deaths per 100,000 live births, according to UN inter-agency estimates. This translates into an average annual rate of reduction of 2.3 per cent. While impressive, this is less than half the 5.5 per cent annual rate needed to achieve the three-quarters reduction in maternal mortality targeted for 2015 in Millennium Development Goal 5. Every region has advanced, although levels of maternal mortality remain unacceptably high in sub-Saharan Africa. Almost all maternal deaths can be prevented, as evidenced by the huge disparities found between the richest and poorest countries. The lifetime risk of maternal death in high-income countries is 1 in 3,300, compared to 1 in 41 in low-income.
-
Июль 2017Источник: United Nations Children's FundЗагружен: KnoemaДата обращения к источнику: 23 августа, 2017ВыбратьAccording to UNICEF report, in 2015, seven out of ten people used a safely managed drinking water service. Universal access to safe drinking water is a fundamental need and human right. Securing access for all would go a long way in reducing illness and death, especially among children. Since 2000, 1.4 billion people have gained access to basic drinking water services, such as piped water into the home or a protected dug well. In 2015, 844 million people still lack a basic water service and among them almost 159 million people still collected drinking water directly from rivers, lakes and other surface water sources. The data reveal pronounced disparities, with the poorest and those living in rural areas least likely to use a basic service. “Safely managed” water services represent an ambitious new rung on the ladder used to track progress on drinking water. In 2015, 5.2 billion people used safely managed services, i.e. accessible on premises, available when needed and free from contamination. A further 1.3 billion used a ‘basic’ water service, i.e. improved sources within 30 minutes per round trip to collect water. Over a quarter of a billion (258 million) used a ‘limited’ service where water collection from an improved source exceeded 30 minutes. In most countries the burden of water collection continues to fall mainly to women and girls.
-
Октябрь 2018Источник: United Nations Children's FundЗагружен: KnoemaДата обращения к источнику: 18 декабря, 2018ВыбратьMillions of children are not protected against Violence, Child labor, Trafficking, Sexual exploitation, Female genital mutilation/cutting, Child marriage and worldwide they experience the worst kinds of rights violations. Millions more children, not yet victims, are inadequately protected against them. UNICEF uses the term ‘Child Protection’ to refer to prevention and response to violence, exploitation and abuse of children in all contexts. This includes reaching children who are especially vulnerable to these threats, such as those living without family care, on the streets or in situations of conflict or natural disasters. Note: Year 2010-2016 is taken as 2016
-
Октябрь 2015Источник: Joint United Nations Programme on HIV/AIDSЗагружен: KnoemaДата обращения к источнику: 26 февраля, 2016ВыбратьUNAIDS was mandated by the UN General Assembly to monitor progress on global AIDS response in the 2001 General Assembly Special Session on HIV and AIDS, and reaffirmed in the 2011 High Level Meeting. The Global AIDS Response Progress Reporting data consists of 30 indicators, divided by 10 global targets, which are reported by participating countries on their national response to HIV/AIDS. Data used to be reported every second year from 2004 until 2012, However, starting 2013, data are collected every year to enable effective monitoring towards Millennium Development Goals of 2015. Collected data are published as part of the Global Report on AIDS. In 2014, 180 out of 193 UN member states (171 in 2013) submitted their reports.
-
Ноябрь 2018Источник: DevInfoЗагружен: KnoemaДата обращения к источнику: 05 декабря, 2018ВыбратьThis database contains country-reported GAM data. For HIV epidemiological estimates, as well as ART and PMTCT indicators
-
Июль 2018Источник: Joint United Nations Programme on HIV/AIDSЗагружен: KnoemaДата обращения к источнику: 07 августа, 2018ВыбратьThis Dataset contains Regional and National level Data.
-
Декабрь 2018Источник: United Nations Office on Drugs and CrimeЗагружен: KnoemaДата обращения к источнику: 18 января, 2019ВыбратьIntentional homicide is defined as unlawful death purposefully inflicted on a person by another person
-
Декабрь 2018Источник: Organisation for Economic Co-operation and DevelopmentЗагружен: KnoemaДата обращения к источнику: 24 апреля, 2019ВыбратьUranium is the raw material used to produce fuel for long-lived nuclear power facilities, necessary for the generation of significant amounts of baseload low-carbon electricity for decades to come. Although a valuable commodity, declining market prices for uranium in recent years, driven by uncertainties concerning the evolution in the use of nuclear power, have led to significant production cutbacks and the postponement of mine development plans in a number of countries and to some questions being raised about future uranium supply.
-
Сентябрь 2018Источник: U.S. Department of Homeland SecurityЗагружен: KnoemaДата обращения к источнику: 20 ноября, 2018ВыбратьThe Yearbook of Immigration Statistics is a compendium of tables that provides data on foreign nationals who, during a fiscal year, were granted lawful permanent residence (i.e., admitted as immigrants or became legal permanent residents), were admitted into the United States on a temporary basis (e.g., tourists, students, or workers), applied for asylum or refugee status, or were naturalized.
-
Февраль 2018Источник: U.S. Department of Commerce, International Trade AdministrationЗагружен: KnoemaДата обращения к источнику: 13 марта, 2019ВыбратьUS: Medium, Heavy Duty & Other Trucks Exports/Imports Data
- V
-
Май 2019Источник: Statistics DenmarkЗагружен: KnoemaДата обращения к источнику: 30 мая, 2019ВыбратьValue of exports by SHORT-TERM (industrial origin), country, imports and exports and time
-
Май 2019Источник: Statistics DenmarkЗагружен: KnoemaДата обращения к источнику: 13 мая, 2019Выбрать
-
Value of imports and exports by BEC (Broad Economic Categories), country, imports and exports and timeМай 2019Источник: Statistics DenmarkЗагружен: KnoemaДата обращения к источнику: 30 мая, 2019ВыбратьValue of imports and exports by BEC (Broad Economic Categories), country, imports and exports and time
-
Value of imports and exports by BEC (Broad Economic Categories), country, imports and exports and time, DenmarkМай 2019Источник: Statistics DenmarkЗагружен: KnoemaДата обращения к источнику: 13 мая, 2019Выбрать
-
Май 2019Источник: Statistics DenmarkЗагружен: KnoemaДата обращения к источнику: 13 мая, 2019Выбрать
- W
-
-
Сентябрь 2015Источник: Water FootPrint NetworkЗагружен: KnoemaДата обращения к источнику: 27 октября, 2015ВыбратьData cited at: The Water Footprint Network https://waterfootprint.org/en/ Topic: Product water footprint statistics Publication: https://waterfootprint.org/en/resources/waterstat/product-water-footprint-statistics/ Reference: Mekonnen, M.M. & Hoekstra, A.Y. (2011) The green, blue and grey water footprint of crops and derived crop products, Hydrology and Earth System Sciences, 15(5): 1577-1600. License: https://creativecommons.org/licenses/by-sa/3.0/
-
Сентябрь 2015Источник: Water FootPrint NetworkЗагружен: KnoemaДата обращения к источнику: 27 октября, 2015ВыбратьData cited at: The Water Footprint Network https://waterfootprint.org/en/ Topic: Product water footprint statistics Publication: https://waterfootprint.org/en/resources/waterstat/product-water-footprint-statistics/ Reference: Mekonnen, M.M. & Hoekstra, A.Y. (2012) A global assessment of the water footprint of farm animal products, Ecosystems, 15(3): 401–415. License: https://creativecommons.org/licenses/by-sa/3.0/
-
Сентябрь 2015Источник: Water FootPrint NetworkЗагружен: KnoemaДата обращения к источнику: 27 октября, 2015ВыбратьData cited at: The Water Footprint Network https://waterfootprint.org/en/ Topic: Product water footprint statistics Publication: https://waterfootprint.org/en/resources/waterstat/product-water-footprint-statistics/ Reference: Mekonnen, M.M. & Hoekstra, A.Y. (2011) National water footprint accounts: the green, blue and grey water footprint of production and consumption, Value of Water Research Report Series No.50, UNESCO-IHE, Delft, the Netherlands. License: https://creativecommons.org/licenses/by-sa/3.0/
-
Март 2019Источник: World BankЗагружен: KnoemaДата обращения к источнику: 20 марта, 2019ВыбратьData cited at: The World Bank https://datacatalog.worldbank.org/ Topic:Wealth Accounting Publication: https://datacatalog.worldbank.org/dataset/wealth-accounting License: http://creativecommons.org/licenses/by/4.0/ The wealth accounting approach provides two related sets of information: comprehensive wealth accounts (a stock measure in total and per capita values), and adjusted net saving (a flow measure). The wealth accounts were updated in 2018, using a new methodology described in The Changing Wealth of Nations 2018.
-
Июнь 2018Источник: World Economics and Politics (WEP) DataverseЗагружен: KnoemaДата обращения к источнику: 25 сентября, 2018ВыбратьData cited at: World Economics and Politics (WEP) Dataverse World Economic and Politics dataverse- 1800 to 2017
-
Август 2015Источник: United Nations World Food ProgrammeЗагружен: KnoemaДата обращения к источнику: 04 августа, 2015Выбрать
-
Май 2012Источник: World Health OrganizationЗагружен: KnoemaДата обращения к источнику: 01 июня, 2012ВыбратьBody mass index (BMI) is a simple index of weight-for-height that is commonly used to classify overweight and obesity in adults. It is defined as a person's weight in kilograms divided by the square of his height in meters (kg/m2). The WHO definition is: a BMI greater than or equal to 25 is overweight a BMI greater than or equal to 30 is obesity. BMI provides the most useful population-level measure of overweight and obesity as it is the same for both sexes and for all ages of adults. However, it should be considered a rough guide because it may not correspond to the same degree of fatness in different individuals.
-
Ноябрь 2018Источник: World Health OrganizationЗагружен: KnoemaДата обращения к источнику: 30 ноября, 2018ВыбратьThe World malaria report 2018 draws on data from 90 countries and areas with ongoing malaria transmission. The information is supplemented by data from national household surveys and databases held by other organizations.
-
Июль 2017Источник: World Health OrganizationЗагружен: KnoemaДата обращения к источнику: 08 февраля, 2018Выбрать
-
Октябрь 2012Источник: World Wide Fund for NatureЗагружен: KnoemaДата обращения к источнику: 16 февраля, 2016ВыбратьDomestic ivory market score: Scores range from –4, indicating no or very small, highly-regulated domestic ivory markets and carving industries, to 20, indicating extremely large, completely unregulated domestic ivory markets and carving industries. As described in CoP13 Doc.29,2 Annex, this component is based upon a cumulative scoring system which tracks the relative scale of the retail-level trade, the degree of control over such trade, and the status of ivory carving. Law enforcement effort ratio: Number of in-country seizures divided by total number of seizures linked to that country 1999-2010. Total weight of recent ivory seizures: Total weight of ivory seizures linked to that country 1999-2010. Organized crime indicator: Percentage of seizure cases linked to that country 1999-2010 of more than 1,000 kg in weight, indicative of involvement of organized crime in the movement of ivory.
-
Май 2019Источник: International Labour OrganizationЗагружен: KnoemaДата обращения к источнику: 24 мая, 2019ВыбратьWorkers involved in strikes and lockouts represents the number of workers implicated directly or indirectly at any time during a strike or lockout, whether the involvement was for the full duration of the strike or lockout or only part of it. Workers who are unable to work as a result of the secondary effects of strikes or lockouts should not be included. Data are disaggregated by economic activity according to the latest version of the International Standard Industrial Classification of All Economic Activities (ISIC) available for that year. Economic activity refers to the main activity of the establishment in which a person worked during the reference period and does not depend on the specific duties or functions of the person's job, but on the characteristics of the economic unit in which this person works.
-
Май 2019Источник: International Labour OrganizationЗагружен: KnoemaДата обращения к источнику: 20 мая, 2019ВыбратьThe working poverty rate conveys the percentage of employed persons living in poverty in spite of being employed. Poverty is defined using the international poverty line of US$1.90 per day in purchasing power parity (PPP). For further information, see the SDG Indicators Metadata Repository.
-
Май 2019Источник: International Labour OrganizationЗагружен: KnoemaДата обращения к источнику: 27 мая, 2019ВыбратьThe working-age population is commonly defined as persons aged 15 years and older, but this varies from country to country. In addition to using a minimum age threshold, certain countries also apply a maximum age limit.
-
Август 2018Источник: Scimago LabЗагружен: KnoemaДата обращения к источнику: 16 августа, 2018ВыбратьSCImago Journal Rank: It expresses the average number of weighted citations received in the selected year by the documents published in the selected journal in the three previous years, --i.e. weighted citations received in year X to documents published in the journal in years X-1, X-2 and X-3. H Index: The h index expresses the journal's number of articles (h) that have received at least h citations. It quantifies both journal scientific productivity and scientific impact and it is also applicable to scientists, countries, etc. Total Documents: Output of the selected period. All types of documents are considered, including citable and non citable documents. Total Cites (3years): Number of citations received in the seleted year by a journal to the documents published in the three previous years, --i.e. citations received in year X to documents published in years X-1, X-2 and X-3. All types of documents are considered. Self Cites: Number of journal's self-citations in the selected year to its own documents published in the three previous years, --i.e. self-citations in year X to documents published in years X-1, X-2 and X-3. All types of documents are considered. Cited Documents: Number of documents cited at least once in the three previous years, --i.e. years X-1, X-2 and X-3 Cites per Document (2 years): Average citations per document in a 2 year period. It is computed considering the number of citations received by a journal in the current year to the documents published in the two previous years, --i.e. citations received in year X to documents published in years X-1 and X-2.
-
Октябрь 2018Источник: World BankЗагружен: KnoemaДата обращения к источнику: 31 октября, 2018ВыбратьNote: In recent years, Doing Business introduced improvements to all of its indicator sets. In Doing Business 2015, Resolving Insolvency introduced new measures of quality, while Getting Credit and Protecting Minority Investors broadened their existing measures. In Doing Business 2016, Dealing with Construction Permits, Getting Electricity, Registering Property and Enforcing Contracts also introduced new measures of quality, and Trading across Borders introduced a new case scenario to increase the economic relevance. In Doing Business 2017, Paying Taxes introduced new measures of post-filing processes and Starting a Business, Registering Property and Enforcing Contracts added gender components. For the details on the Doing Business methodology changes, please view the Ease of Doing Business metrics. Each methodology expansion was recalculated for one year to provide comparable indicator values and scores for the previous year. Rankings are calculated for Doing Business 2019 only. Year-to-year changes in the number of economies, number of indicators and methodology affect the comparability of prior years.
-
Май 2019Источник: World BankЗагружен: KnoemaДата обращения к источнику: 12 мая, 2019ВыбратьData cited at: The World Bank https://datacatalog.worldbank.org/ Topic: Global Economic Monitor Publication: https://datacatalog.worldbank.org/dataset/global-economic-monitor License: http://creativecommons.org/licenses/by/4.0/ The dataset Provides daily updates of global economic developments, with coverage of high income- as well as developing countries. Average period data updates are provided for exchange rates, equity markets, interest rates, stripped bond spreads, and emerging market bond indices. Monthly data coverage (updated daily and populated upon availability) is provided for consumer prices, high-tech market indicators, industrial production and merchandise trade.
-
Февраль 2015Источник: World BankЗагружен: KnoemaДата обращения к источнику: 05 ноября, 2015ВыбратьData cited at: The World Bank https://datacatalog.worldbank.org/ Topic: Trade In Services Database Publication: https://datacatalog.worldbank.org/dataset/trade-services-database License: http://creativecommons.org/licenses/by/4.0/ The Trade in Services Database provides information on annual bilateral services trade flows in Mode 1 (cross-border trade) and Mode 2 (consumption abroad) for 199 countries across a multitude of sectors and years spanning 1985 and 2011. The collection of data on cross-border trade in services is notoriously difficult, in large part due to the intangible nature of services but also the high capacity needed to record such data. This is particularly true for developing countries. This database tries to fill this gap by consolidating multiple sources of bilateral trade data in services using mirror techniques, including the OECD, Eurostat, UN and IMF, as to provide a broader coverage of developed and developing countries over time. Mirror-technique is a method to retrieve export trade flows of a reporter by using information on imports of the partner country.
-
Август 2018Источник: World BankЗагружен: KnoemaДата обращения к источнику: 21 августа, 2018ВыбратьClimate change is expected to hit developing countries the hardest. Its effects—higher temperatures, changes in precipitation patterns, rising sea levels, and more frequent weather-related disasters—pose risks for agriculture, food, and water supplies. At stake are recent gains in the fight against poverty, hunger and disease, and the lives and livelihoods of billions of people in developing countries. Addressing climate change requires unprecedented global cooperation across borders. The World Bank Group is helping support developing countries and contributing to a global solution, while tailoring our approach to the differing needs of developing country partners. Data here cover climate systems, exposure to climate impacts, resilience, greenhouse gas emissions, and energy use. Other indicators relevant to climate change are found under other data pages, particularly Environment, Agriculture & Rural Development, Energy & Mining, Health, Infrastructure, Poverty, and Urban Development.
-
Июнь 2014Источник: World BankЗагружен: KnoemaДата обращения к источнику: 30 августа, 2017ВыбратьData cited at: The World Bank https://datacatalog.worldbank.org/ Topic: Comparative Advantage, International Trade, And Fertility Publication: https://datacatalog.worldbank.org/dataset/comparative-advantage-international-trade-and-fertility License: http://creativecommons.org/licenses/by/4.0/ The paper associated with this dataset analyzes theoretically and empirically the impact of comparative advantage in international trade on fertility. It builds a model in which industries differ in the extent to which they use female relative to male labor and countries are characterized by Ricardian comparative advantage in either female labor or male labor intensive goods. The values of "Share of Female Workers in Total Employment by Sectors" are reported for the full country sample, and OECD and non-OECD separately. The values of "Female Labor Needs of Exports" by country and 5-year interval. The "Year" denotes the beginning of a 5-year period, i.e., year = 1960 denotes an average over 1960-1964
-
Июнь 2016Источник: World BankЗагружен: KnoemaДата обращения к источнику: 31 августа, 2017ВыбратьThe G20 Basic Set of Financial Inclusion data repository includes detailed data from users and providers of financial services. The Basic Set measures both access to financial services (“supply-side” data) and usage of services (“demand-side” data). The Basic Set covers both individuals and small and medium sized enterprises (SME’s) and includes data from three sources and 192 countries. The five basic set indicators are as follows: 1.The percentage of adults with a formal account; 2. The percentage of adults that use formal credit; 3. The percentage of SME’s with a formal account; 4. The percentage of SME’s that use formal credit; and 5. Bank branch penetration.
-
Март 2019Источник: World BankЗагружен: KnoemaДата обращения к источнику: 20 марта, 2019ВыбратьData cited at: The World Bank https://datacatalog.worldbank.org/ Topic: Sustainable Energy For All Publication: https://datacatalog.worldbank.org/dataset/sustainable-energy-all License: http://creativecommons.org/licenses/by/4.0/ The “Sustainable Energy for all (SE4ALL)” initiative, launched in 2010 by the UN Secretary General, established three global objectives to be accomplished by 2030: to ensure universal access to modern energy services, to double the global rate of improvement in global energy efficiency, and to double the share of renewable energy in the global energy mix. SE4ALL database supports this initiative and provides country level historical data for access to electricity and non-solid fuel; share of renewable energy in total final energy consumption by technology; and energy intensity rate of improvement.
-
-
Апрель 2019Источник: World BankЗагружен: KnoemaДата обращения к источнику: 01 мая, 2019ВыбратьThe primary World Bank collection of development indicators, compiled from officially-recognized international sources. It presents the most current and accurate global development data available, and includes national, regional and global estimates
-
Октябрь 2016Источник: International Federation of Red Cross and Red Crescent SocietiesЗагружен: KnoemaДата обращения к источнику: 22 ноября, 2016Выбрать
-
Март 2019Источник: United Nations Department of Economic and Social AffairsЗагружен: KnoemaДата обращения к источнику: 22 марта, 2019ВыбратьEconomic growth accelerated in more than half the world’s economies in both 2017 and 2018. Developed economies expanded at a steady pace of 2.2 per cent in both years, and growth rates in many countries have risen close to their potential, while unemployment rates in several developed economies have dropped to historical lows. Among the developing economies, the regions of East and South Asia remain on relatively strong growth trajectory, expanding by 5.8 per cent and 5.6 per cent, respectively in 2018. Many commodityexporting countries, notably fuel exporters, are continuing a gradual recovery, although they remain exposed to volatile prices. The impact of the sharp drop in commodity markets in 2014/15 also continues to weigh on fiscal and external balances and has left a legacy of higher levels of debt. Global economic growth remained steady at 3.1 per cent in 2018, as a fiscally induced acceleration in the United States of America offset slower growth in some other large economies. Economic activity at the global level is expected to expand at a solid pace of 3 per cent in 2019, but there are increasing signs that growth may have peaked. The growth in global industrial production and merchandise trade volumes has been tapering since the beginning of 2018, especially in trade-intensive capital and intermediate goods sectors. Leading indicators point to some softening in economic momentum in many countries in 2019, amid escalating trade disputes, risks of financial stress and volatility, and an undercurrent of geopolitical tensions. At the same time, several developed economies are facing capacity constraints, which may weigh on growth in the short term.
-
Декабрь 2017Источник: United Nations World Food ProgrammeЗагружен: KnoemaДата обращения к источнику: 24 марта, 2019ВыбратьThe World Food Prices Database has data on food prices (e.g., beans, rice, fish, and sugar) for 76 countries and some 1,500 markets. The dataset includes around 500,000 records and is updated monthly. The data goes back as far as 1992 for a few countries, although most of the price trends start in.
-
Октябрь 2018Источник: Charities Aid FoundationЗагружен: KnoemaДата обращения к источнику: 28 ноября, 2018ВыбратьData cited at: Charities Aid Foundation CAF World Giving Index 2018 : This ninth edition of the CAF World Giving Index presents giving data from across the globe over a five year period (2013-2017). The CAF World Giving Index 2018 includes data from 146 countries that was collected throughout 2017. A full explanation of the methodology used is included in the appendices. CAF World Giving Index ranking and scores: The method used to calculate CAF World Giving Index scores remains identical to previous years. In order to establish a rounded measure of giving behavior across the world, the CAF World Giving Index relies on a simple averaging of the responses from the three key questions asked in each country. Each country is given a percentage score and countries are ranked on the basis of these scores.
-
Март 2019Источник: Sustainable Development Solutions NetworkЗагружен: KnoemaДата обращения к источнику: 22 марта, 2019ВыбратьFull version of the Index is available at: https://knoema.com/SDSNWHP2019/world-happiness-index-2019-full-version The World Happiness Report is a landmark survey of the state of global happiness that ranks 156 countries by how happy their citizens perceive themselves to be. In 2019, World Happiness Report focuses on happiness and the community: how happiness has evolved over the past dozen years, with a focus on the technologies, social norms, conflicts and government policies that have driven those changes.
-
Март 2019Источник: Sustainable Development Solutions NetworkЗагружен: KnoemaДата обращения к источнику: 22 марта, 2019ВыбратьNote: https://knoema.com/SDSNWHP2016/world-happiness-index-2019 The World Happiness Report is a landmark survey of the state of global happiness that ranks 156 countries by how happy their citizens perceive themselves to be. In 2019, World Happiness Report focuses on happiness and the community: how happiness has evolved over the past dozen years, with a focus on the technologies, social norms, conflicts and government policies that have driven those changes.
-
Апрель 2014Источник: The Earth Institute, Columbia UniversityЗагружен: KnoemaДата обращения к источнику: 03 апреля, 2014ВыбратьThe World Happiness Report 2013 is a study conducted by Columbia University's Earth Institute and published in September 2013 by the Sustainable Development Solutions Network (SDSN). It reveals trends in the data judging just how happy countries really are on a scale running from 0 to 10. The report uses data from people in over 150 countries, surveyed by Gallup over the period 2010-12. Six key variables explain three-quarters of the variation in annual national average scores over time and among countries. These six factors include: real GDP per capita, healthy life expectancy, having someone to count on, perceived freedom to make life choices, freedom from corruption, and generosity. Note: datapoints for 2012 and 2007 refer to national averages in 2010-12 and 2005-07 correspondingly; changes from 2005-07 to 2010-12 are presented for the 130 countries with data in both periods; positive affect in 2005-07 does not include happiness (yesterday) since happiness data were not collected in the period. Reference: World Happiness Report 2013, Appendix material for Chapter 2 "World Happiness: Trends, Explanations and Distribution", John F. Helliwell & Shun Wang.
-
Май 2014Источник: World Health OrganizationЗагружен: KnoemaДата обращения к источнику: 18 июня, 2014ВыбратьIncludes datasets on communicable diseases, human resources for health, noncommunicable diseases and world health statistics.
-
Апрель 2019Источник: Organisation for Economic Co-operation and DevelopmentЗагружен: KnoemaДата обращения к источнику: 12 апреля, 2019ВыбратьWorld Indicators of Skills for Employment (WISE) provide a comprehensive system of information relating to skills development. WISE presents countries with data upon which they can design skills policies and programs and monitor their impact on key outcomes, including responsiveness to current and emerging patterns of labour market demand, employability, productivity, health status, gender equity and lifelong learning.The database covers the period from 1990 to the present and consists of five inter-related domains of indicators:Contextual factors drive both the supply of and demand for skills.Skill acquisition covers investments in skills, the stock of human capital and its distribution.Skill requirements measure the demand for skills arising in the labour market.The degree of matching captures how well skills obtained through education and training correspond to the skills required in the labour market.Outcomes reflect the impact of skills on economic performance and employment and social outcomes.
-
Декабрь 2018Источник: World Integrated Trade SolutionЗагружен: KnoemaДата обращения к источнику: 21 января, 2019ВыбратьData cited at: The World Bank https://datacatalog.worldbank.org/ Topic: World Integrated Trade Solution Trade Stats Publication: https://datacatalog.worldbank.org/dataset/world-integrated-trade-solution-trade-stats License: http://creativecommons.org/licenses/by/4.0/ WITS Trade Stats is a database created by aggregating data from UN COMTRADE and UNCTAD TRAINS database. It provides information on bilateral trade exports, imports and tariffs for over 180 countries and regions.
-
Июнь 2018Источник: United Nations Conference on Trade and DevelopmentЗагружен: KnoemaДата обращения к источнику: 08 июня, 2018ВыбратьThe World Investment Report focuses on trends in foreign direct investment (FDI) worldwide, at the regional and country levels and emerging measures to improve its contribution to development. This Report further focuses on:Analysis of the trends in FDI during the previous year, with especial emphasis on the development implications.Ranking of the largest transnational corporations in the world.In-depth analysis of a selected topic related to FDI.Policy analysis and recommendations.Statistical annex with data on FDI flows and stocks for 196 economies.
-
Июнь 2018Источник: EthnologueЗагружен: KnoemaДата обращения к источнику: 22 ноября, 2018ВыбратьThe World Languages section of this site provides country summaries and language-by-language information. This section steps above that detail to offer a summary view of the world language situation. Specifically, it offers numerical tabulations of languages and number of speakers by world area, by language size, by language status, by language family, and by country.
-
Май 2018Источник: British Geological SurveyЗагружен: KnoemaДата обращения к источнику: 22 марта, 2019ВыбратьWorld Mineral Production covers the majority of economically important mineral commodities. For each commodity constant efforts are made to ensure that as many producing countries as possible are reported. For some commodities, where statistics on production are not publicly available, estimates are made.
-
Ноябрь 2018Источник: United Nations Conference on Trade and DevelopmentЗагружен: KnoemaДата обращения к источнику: 13 февраля, 2019ВыбратьThis table provides estimates from 1950 to 2016 and projections from 2017 to 2050 (Medium Variant), of total population and urban population, expressed in thousands and as a percentage of total population, respectively.
-
Июнь 2017Источник: United Nations Department of Economic and Social AffairsЗагружен: KnoemaДата обращения к источнику: 22 июня, 2018ВыбратьThe 2017 Revision of World Population Prospects is the twenty-fifth round of official United Nations population estimates and projections that have been prepared by the Population Division of the Department of Economic and Social Affairs of the United Nations Secretariat. It includes key demographic indicators for each development group, income group, region, subregion and country or area for selected periods or dates within 1950-2100.
-
Апрель 2019Источник: Reporters Without BordersЗагружен: KnoemaДата обращения к источнику: 13 мая, 2019ВыбратьThe Range of Score to Access the Press Freedom. From 0 to 15 points: Good From 15.01 to 25 points: Fairly good From 25.01 to 35 points: Problematic From 35.01 to 55 points: Bad From 55.01 to 100 points: Very bad Note: Negative value is available for 2012 only and it represents the country in top* The press freedom index that Reporters Without Borders publishes every year measures the level of freedom of information in nearly 180 countries. It reflects the degree of freedom that journalists, news organizations and netizens enjoy in each country, and the efforts made by the authorities to respect and ensure respect for this freedom. It is based partly on a questionnaire that is sent to our partner organizations (18 freedom of expression NGOs located in all five continents), to our network of 150 correspondents, and to journalists, researchers, jurists and human rights activists. The 179 countries ranked in this year’s index are those for which Reporters Without Borders received completed questionnaires from various sources. Some countries were not included because of a lack of reliable, confirmed data. A score and a position are assigned to each country in the final ranking. They are complementary indicators that together assess the state of press freedom. In order to make the index more informative and make it easier to compare different years, scores will henceforth range from 0 to 100, with 0 being the best possible score and 100 the worst. The index reflects the situation during a specific period. This year’s index is based solely on events between the start of December 2012 and the end of November 2013. It does not look at human rights violations in general, just violations of freedom of information. The index should in no way be taken as an indication of the quality of the media in the countries concerned. *In order to have a bigger spread in the scores and increase the differentiation between countries, this year’s questionnaire had more answers assigning negative points. That is why countries at the top of the index have negative scores this year. Although the point system has produced a broader distribution of scores than in 2010, each country’s evolution over the years can still be plotted by comparing its position in the index rather than its score. This is what the arrows in the table refer to – a country’s change in position in the index compared with the preceding year.
-
Октябрь 2013Источник: World BankЗагружен: KnoemaДата обращения к источнику: 24 ноября, 2014ВыбратьData cited at: The World Bank https://datacatalog.worldbank.org/ Topic: World Report On Disability Publication: https://datacatalog.worldbank.org/dataset/world-report-disability License: http://creativecommons.org/licenses/by/4.0/ This dataset provides the World report on disability, Technical appendix A: Estimates of disability prevalence (%) and of years of health lost due to disability (YLD), by country
-
Декабрь 2011Источник: World Resources InstituteЗагружен: KnoemaДата обращения к источнику: 15 декабря, 2011ВыбратьWater Resources and Freshwater Ecosystems
-
Март 2019Источник: International Monetary FundЗагружен: KnoemaДата обращения к источнику: 14 мая, 2019ВыбратьThe IMF’s World Revenue Longitudinal Data set (WoRLD) is a compilation of government tax and non-tax revenues from the IMF’s Government Finance Statistics and World Economic Outlook, and drawing on the OECD Revenue Statistics and Revenue Statistics in Latin American and the Caribbean.
-
Июль 2018Источник: World Trade OrganizationЗагружен: KnoemaДата обращения к источнику: 27 мая, 2019ВыбратьNote: For missing dates in source, we have considers as report date and kept it as 2018 for not loosing information for the country. World Tariff Profiles, a joint publication of the WTO, International Trade Centre (ITC) and the United Nations Conference on Trade and Development (UNCTAD), provides comprehensive information on the tariffs and non-tariff measures imposed by over 170 countries and customs territories. Binding coverage: Share of HS six-digit subheadings containing at least one bound tariff line. Full binding coverage is indicated by 100 without further decimals. If some tariff lines are unbound but the result still rounds to 100 this is reflected by maintaining one decimal, i.e. 100.0. Simple average: Simple average of the ad valorem or AVE HS six-digit duty averages. Duty-free: Share of duty-free HS six-digit subheadings in the total number of subheadings in the product group. Partially duty-free subheadings are taken into account on a pro rata basis. Share of HS six-digit subheadings subject to non-ad valorem duties. When only part of the HS six-digit subheading is subject to non-ad valorem duties the percentage share of these tariff lines is used. Non-ad valorem duties: Share of HS six-digit subheadings subject to ad valorem duties or AVEs greater than 15 per cent. When only part of the HS six-digit subheading is covered by such duties, the calculation is done on a pro rata basis. Duties > 15 %: Share of HS six-digit subheadings subject to ad valorem duties or AVEs greater than three times the national average. When only part of the HS six-digit subheading is covered by such duties, the calculation is done on a pro rata basis. Duties > 3 * AVG: Share of HS six-digit bound subheadings not yet implemented in 2017. When only part of the HS six-digit subheading is covered by such duties the calculation is made on a pro rata basis. Maximum duty: Maximum tariff line level ad valorem duty or AVE. Number of distinct duty rates: Number of distinct duty rates. Non-ad valorem duties are always treated as distinct because AVE calculations would always yield distinct AVEs. For this indicator, however, duties not provided are not included in the count. Coefficient of variation: Standard deviation of tariff line duty rates divided by the simple tariff line level average of all duty rates. Includes only ad valorem duties or AVEs. Number of MFN applied tariff lines: Total number of MFN applied tariff lines.
-
Сентябрь 2017Источник: World Tourism OrganizationЗагружен: KnoemaДата обращения к источнику: 31 октября, 2017ВыбратьWorld Tourism Organization Database
-
Сентябрь 2017Источник: World Tourism OrganizationЗагружен: KnoemaДата обращения к источнику: 16 ноября, 2017ВыбратьWorld Tourism Organization, Country Specified Database, 2016
-
Апрель 2018Источник: World Travel and Tourism CouncilЗагружен: KnoemaДата обращения к источнику: 11 апреля, 2018ВыбратьTravel & Tourism is a truly global economic activity – one which takes place in destinations across the world, from leading capital cities and smaller towns and villages in rural and coastal areas, to some of the remotest points on the planet. It is one of the world’s largest industries, or economic sectors, contributing trillions of dollars annually to the global economy, creating jobs and wealth, generating exports, boosting taxes and stimulating capital investment
-
Апрель 2019Источник: Economic Policy UncertaintyЗагружен: KnoemaДата обращения к источнику: 11 апреля, 2019ВыбратьData cited at: World Uncertainty Index (WUI), developed by Hites Ahir (International Monetary Fund), Nicholas Bloom (Stanford University) and Davide Furceri (International Monetary Fund).
-
Май 2018Источник: United Nations Department of Economic and Social AffairsЗагружен: KnoemaДата обращения к источнику: 26 июня, 2018ВыбратьThe 2018 Revision of World Urbanization Prospects presents the latest United Nations estimates of the size of urban and rural populations for 233 countries or areas from 1950 to 2018, with projections until 2050. It also includes data on population size for close to 1900 urban settlements having 300000 inhabitants or more in 2018. These 1900 cities or urban areas are now home to nearly 60 per cent of the world’s urban population.
-
Август 2018Источник: World BankЗагружен: KnoemaДата обращения к источнику: 27 сентября, 2018ВыбратьThe Worldwide Governance Indicators (WGI) project reports aggregate and individual governance indicators for over 200 countries and territories over the period 1996–2017, for six dimensions of governance:Voice and AccountabilityPolitical Stability and Absence of ViolenceGovernment EffectivenessRegulatory QualityRule of LawControl of Corruption The Worldwide Governance Indicators (WGI) are a research dataset summarizing the views on the quality of governance provided by a large number of enterprise, citizen and expert survey respondents in industrial and developing countries. These data are gathered from a number of survey institutes, think tanks, non-governmental organizations, international organizations, and private sector firms. The WGI do not reflect the official views of the World Bank, its Executive Directors, or the countries they represent. The WGI are not used by the World Bank Group to allocate resources. Measure description: Estimate:-Estimate of governance (ranges from approximately -2.5 (weak) to 2.5 (strong) governance performance) Standard error (StdErr):-Standard error reflects variability around the point estimate of governance. Number of sources (NumSrc):-Number of data sources on which estimate is based Rank:-Percentile rank among all countries (ranges from 0 (lowest) to 100 (highest) rank) Lower:-Lower bound of 90% confidence interval for governance, in percentile rank terms Upper:-Upper bound of 90% confidence interval for governance, in percentile rank terms
-
Ноябрь 2015Источник: Wine InstituteЗагружен: KnoemaДата обращения к источнику: 15 сентября, 2016ВыбратьVineyard acreage is based on United Nations Food & Agriculture Organization (FAO) data, Eurostat data and estimates and reports from individual countries. It includes vineyards used for the production of wine variety grapes, raisin variety grapes, table grapes (for the fresh market) and juice grapes (for the production of grape juice and grape juice concentrate). Wine consumption includes data for 225 countries during the period. Consumption has been estimated by TDA by aggregating the exports of the major wine producing countries to each individual country. The aggregation includes 41 countries including the EU 28, Argentina, Australia, Canada, China, Chile, Hong Kong, New Zealand, Singapore, South Africa, South Korea, Ukraine, United States, and Uruguay. The November 2015 revision pertains to Sweden. Wine production quantity indicated for China does not include the production of Chinese yellow wine; quantity indicated for Japan does not include the production of Sake; quantity indicated for Korea does not include the production of fruit wine and rice wine.
-
Сентябрь 2018Источник: World Trade OrganizationЗагружен: KnoemaДата обращения к источнику: 27 сентября, 2018ВыбратьWTO statistical data sets: Total merchandise trade, Merchandise trade by commodity, Network of world merchandise trade, Selected regional integration agreements, Trade in commercial services, Merchandise trade indices.
- Т
-
Январь 2019Источник: United Nations Economic Commission for EuropeЗагружен: KnoemaДата обращения к источнику: 08 января, 2019Выбрать
-
Январь 2019Источник: United Nations Economic Commission for EuropeЗагружен: KnoemaДата обращения к источнику: 08 января, 2019Выбрать
-
Апрель 2019Источник: United Nations Economic Commission for EuropeЗагружен: KnoemaДата обращения к источнику: 22 апреля, 2019Выбрать
-
Апрель 2019Источник: United Nations Economic Commission for EuropeЗагружен: KnoemaДата обращения к источнику: 22 апреля, 2019Выбрать
-
Апрель 2019Источник: United Nations Economic Commission for EuropeЗагружен: KnoemaДата обращения к источнику: 22 апреля, 2019Выбрать
-
Апрель 2019Источник: United Nations Economic Commission for EuropeЗагружен: KnoemaДата обращения к источнику: 22 апреля, 2019Выбрать
-
Апрель 2019Источник: United Nations Economic Commission for EuropeЗагружен: KnoemaДата обращения к источнику: 22 апреля, 2019Выбрать
- Ч
-
Сентябрь 2018Источник: Federal State Statistics Service, RussiaЗагружен: KnoemaДата обращения к источнику: 15 декабря, 2018ВыбратьМетодологические пояснения: Число отправленных в туры российских туристов включает граждан России, отправленных турфирмами в туры по России и за рубеж. В соответствии с Федеральным Законом Российской Федерации "Об основах туристской деятельности в Российской Федерации" туристом является лицо, посещающее страну (место) временного пребывания в лечебно-оздоровительных, рекреационных, познавательных, физкультурно-спортивных профессионально-деловых, религиозных и иных целях без занятия деятельностью, связанной с получением дохода от источников в стране (месте) временного пребывания, на период от 24 часов до 6 месяцев подряд или осуществляющее не менее одной ночевки в стране (месте) временного пребывания. Ведомство (субъект статистического учета): Федеральная служба государственной статистики Размещение: Основные показатели деятельности туристических фирм Источники и способ формирования показателя: * Сведения о деятельности туристской фирмы
-
Сентябрь 2018Источник: Federal State Statistics Service, RussiaЗагружен: KnoemaДата обращения к источнику: 15 декабря, 2018ВыбратьМетодологические пояснения: Число принятых иностранных туристов включает иностранных граждан, принятых российскими турфирмами на территории Российской Федерации. В соответствии с Федеральным Законом Российской Федерации "Об основах туристской деятельности в Российской Федерации" туристом является лицо, посещающее страну (место) временного пребывания в лечебно-оздоровительных, рекреационных, познавательных, физкультурно-спортивных профессионально-деловых, религиозных и иных целях без занятия деятельностью, связанной с получением дохода от источников в стране (месте) временного пребывания, на период от 24 часов до 6 месяцев подряд или осуществляющее не менее одной ночевки в стране (месте) временного пребывания Ведомство (субъект статистического учета): Федеральная служба государственной статистики Размещение: Основные показатели деятельности туристических фирм Источники и способ формирования показателя: * Сведения о деятельности туристской фирмы