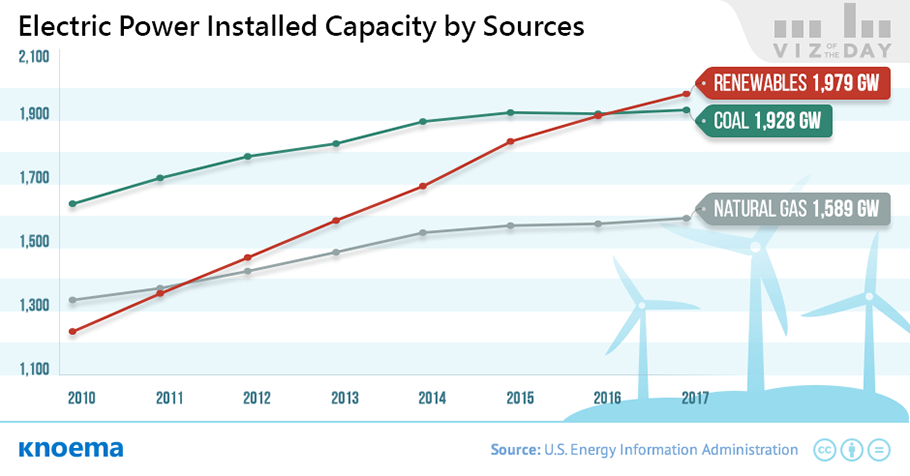
Renewable energy resources have increasingly become mainstream sources of energy worldwide, catapulted by new capacity in developing countries. Depending on the source, renewable energy has or is poised to surpass coal to become the world's largest source of electrical power capacity. The International Energy Agency (IEA) in its most recent medium-term renewable market report said that this transition occurred last year, while according to the latest energy outlook by the US Energy Information Administration (EIA) the transition will be completed in 2016.
- The IEA report shows that in 2015 renewables contributed more than half of the growth of installed power capacity globally.
- New power capacity gains were driven mostly by wind and solar additions, representing 45 and 24 percent of the total renewable capacity increases, respectively.
- In 2015, China accounted for as much as 41 percent of global wind power additions and about 44 percent of the total renewable power capacity increases around the world.
Better access to financing, improving cost-competitiveness of renewable technologies, energy security and environmental concerns, and growing demand for energy have factored into the transformation to different degrees depending on the country and renewable source.
- In 2015, investment in renewables climbed to a new record level. In addition, for the sixth consecutive year, renewables outpaced fossil fuels for net investment in power capacity additions.
- In parallel with growth in markets and investments, 2015 saw continued advances in renewable energy technologies, progress in energy storage development and commercialization, and increased employment in the renewable energy sector.
- The number of countries with policy targets for renewable energy use has risen from 79 in 2008 to 173 in 2015. Iceland and Norway generate all their electricity using renewable energy already, and many other countries have the set a goal to reach 100% renewable-based energy generation. For example, the government of Denmark aims to switch the country's total energy supply - including electricity, mobility, and heating/cooling - to 100% renewable energy by 2050.
 Download
Download our latest ENERGY cheat sheet
It's a one pager PDF full of live links to energy-related data, statistics, and dashboards from leading industry sources. It will be a useful resource for any analyst, business executive, or researcher with an interest in the oil & gas industry, energy companies, biofuels and much more.
Материалы по теме
Crude Oil Price Forecast: 2017, 2018 and Long Term to 2030
Brent crude oil price will average at $52.4 per barrel in 2017 and increase to $54.1 per barrel in 2018 according to the most recent forecast from the U.S. Energy Information Administration's Short-Term Energy Outlook released monthly. EIA revised up its forecast for 2018 by 2.5 dollars per barrel from the previous release. However, the real price of a barrel of Brent oil - i.e. price adjusted for inflation - will slightly decrease to $50 in 2018 as predicted by OECD in its June's Economic Outlook. After a modest growth in 2018 though, the nominal price of Brent crude will increase to $53.5 a barrel by 2020, as per IMF's Primary Commodity...
BP: World Reserves of Fossil Fuels
According to the latest BP Statistical Review of World Energy, total global reserves, by fossil fuel, are now: Coal - 1,139 billion tonnes Natural Gas - 187 trillion cubic meters Crude Oil - 1,707 billion barrels While these volumes may seem large at a glance, at today's level of extraction and production rates, BP's estimated proved reserves*, by fossil fuel, would be exhausted as follows: Coal - year 2169 Natural Gas - year 2068 Crude Oil - year 2066 BP dutifully acknowledges the abundance of factors that could easily alter these projections, but these factors do not alter the global policy imperitive to support sustainable fossil...
Natural Gas Prices Forecast: Long Term 2017 to 2030 | Data and Charts
Autumn and winter are traditionally characterized by the growth in energy consumption and, thus, in prices for energy products. Still, natural gas prices in the US, Europe, and Japan showed different dynamics in November. Thus, the spot price of natural gas at Henry Hub, US, fell by 15.2% in November compared to the previous month. This decline - which was the sharpest monthly drop since December of 2014 - interrupted a period of steady growth lasting from April. On the contrary, in Europe, average import border price of natural gas surged by 14.4% - the most dramatic monthly increase over the last 17 years. What for the import price of...
US: The World's Newest Major Exporter of Crude Oil
To date in 2017, the United States has averaged more than 900,000 barrels per day (b/d) of crude oil exports while sustaining an average import volume of 8.1 million b/d. From 1975 until late 2015, a ban on the export of US crude oil severely restricted crude oil exports from the US to all countries except Canada. In the years leading up to the US shale oil boom in the early years of this decade, the US exported less than 30,000 b/d to Canada. While Canada remains the predominant destination for US crude oil, the repeal of the crude oil ban allowed US exporters to expand to nearly 30 countries last year and an export total of 591,000 b/d. In...